
Figure 4.
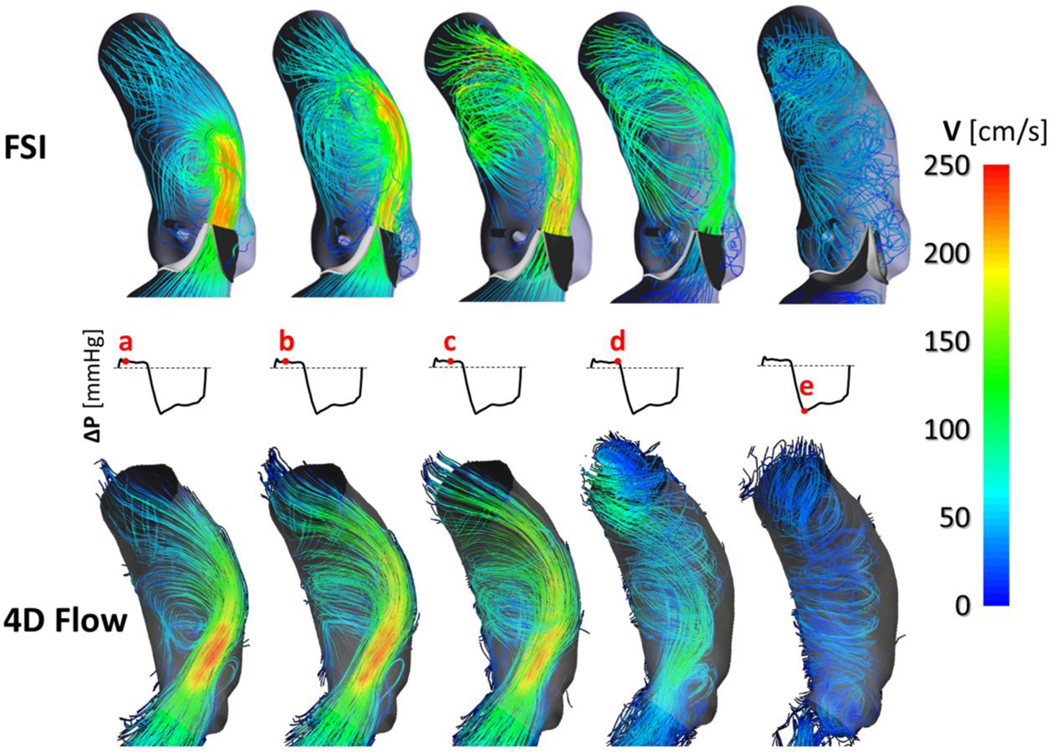
Velocity streamlines extracted at different frames over the cardiac cycle from the FSI model (upper panel) and from the 4D Flow sequence (lower panel), respectively; complete BAV closure is visible during diastole.
Official websites use .gov
A
.gov website belongs to an official
government organization in the United States.
Secure .gov websites use HTTPS
A lock (
) or https:// means you've safely
connected to the .gov website. Share sensitive
information only on official, secure websites.
Velocity streamlines extracted at different frames over the cardiac cycle from the FSI model (upper panel) and from the 4D Flow sequence (lower panel), respectively; complete BAV closure is visible during diastole.