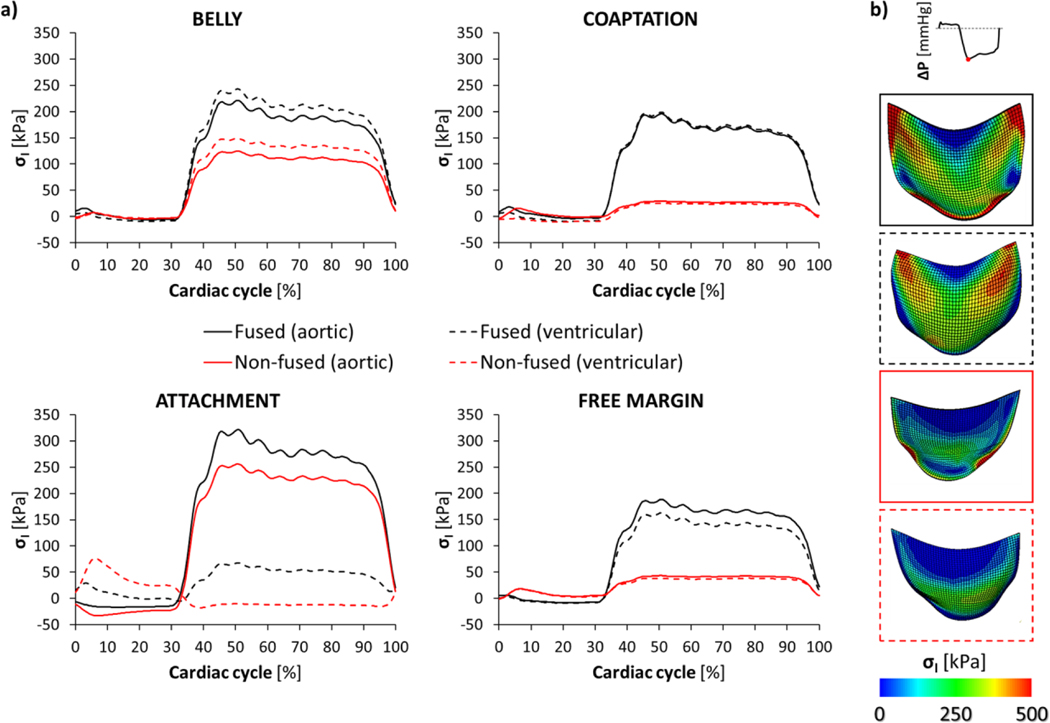
Figure 6.
Maximum principal stress (σI) averaged throughout the cardiac cycle (a) on each region of the fused (black lines) and non-fused (red lines) BAV leaflets, reported for both the aortic (continuous line) and the ventricular (dotted line) surface, respectively; b) contour maps of σI magnitude, extracted from the FSI model at peak of diastolic transvalvular pressure, on BAV leaflets.

