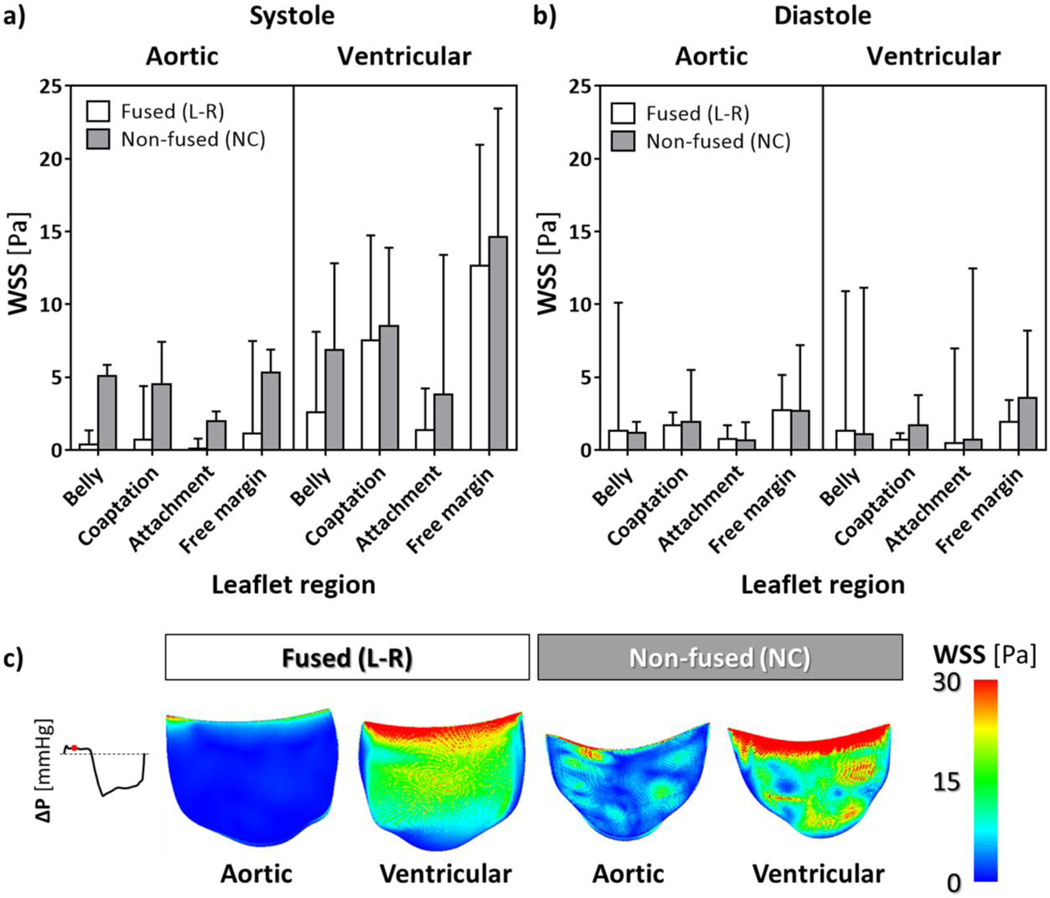
Figure 7.
Median values and upper quartile (i.e., 75th percentile) of WSS distribution on BAV leaflets, averaged during systole (a) and diastole (b) on both the aortic and ventricular surface, for each region of the fused (L-R) and non-fused (NC) leaflet; c) contour maps of mid-systolic WSS magnitude extracted from the FSI model.

