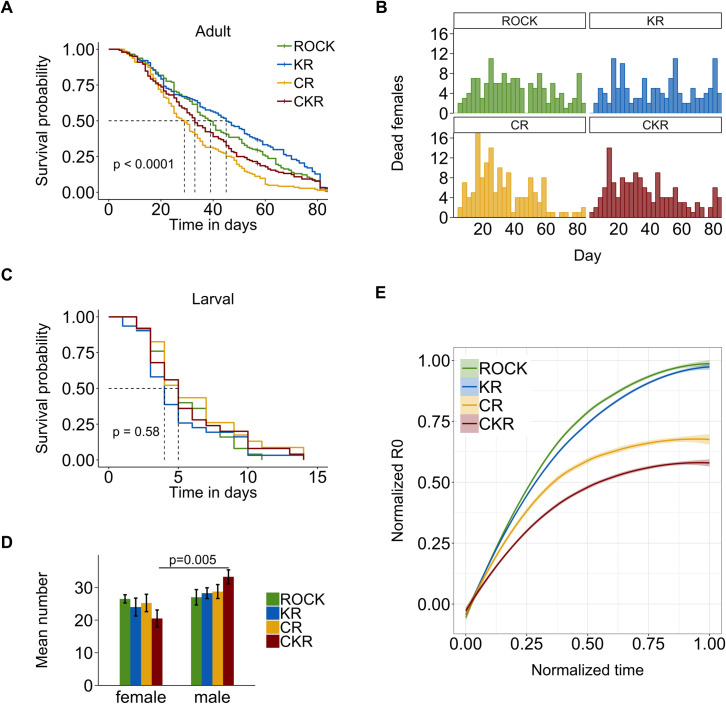
Fig 3. Comparison of life table components in four congenic strains of A. aegypti.
(A) Kaplan-Meyer survival plot of females. (B) Average number of dead females per day for each strain. (C) Kaplan-Meyer survival curve of larvae. (D) Mean number of females and males emerged from an equal number of larvae (sex ratio). Bars represent the standard error of the means. (E) Mean R0 value across three replicates normalized by the highest R0 and time of each replicate.

