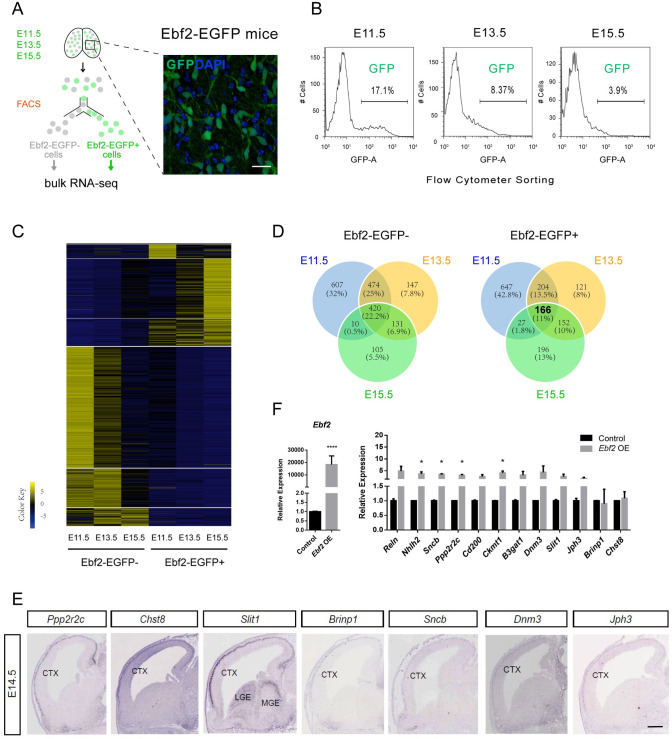
Fig 1. Transcriptome sequencing of Ebf2-EGFP+ and Ebf2-EGFP- cells in the early embryonic stage.
(A) Schematic illustration of FACS purification of Ebf2-EGFP+ and Ebf2-EGFP- cells from early embryonic developmental stages E11.5, E13.5 and E15.5, respectively. (B) The percentages of Ebf2-EGFP+ cells collected from FACS at each stage are calculated and shown in the graph. (C) Heatmap of all differential expressed genes (FDR<0.05) in Ebf2-EGFP+ & Ebf2-EGFP- samples at the three early embryonic stages are shown. (D) Venn diagrams displaying the extent of overlapping between DEGs at the three embryonic stages. (E) Expression of 7 CR-specific coding genes are found to be selectively expressed in cortical layer 1 of E14.5 mouse embryos (In situ hybridization images from GenePaint.org). Scale bar, 650 μm. Another CR-specific coding gene Nhlh2 is shown in the S1D Fig. (F) qRT-PCR analysis comparing the expression levels of CR-specific genes in primary neural cell culture assay after virus infection with control (H1) or Ebf2-overexpression. Data represent mean ± SEM (n = 3 independent experiments, *P<0.05, Student’s T test).

