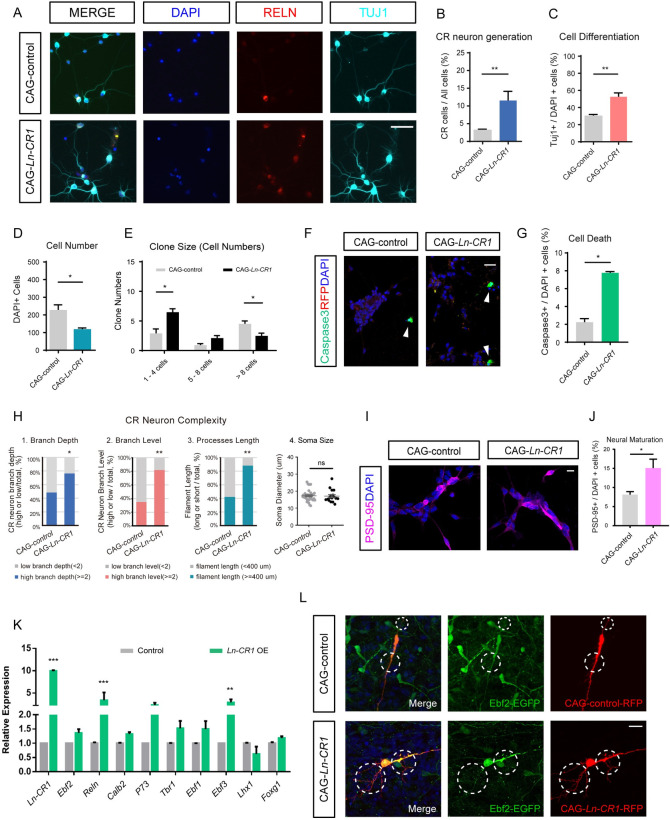
Fig 4. Functional validation of CR-specific lncRNAs Ln-CR1 in vitro and in vivo.
(A) Immunostaining of neural cells treated with control (CAG-control) or overexpression lentiviruses for CR-specific lncRNA Ln-CR1 (CAG-Ln-CR1) after in vitro culture for 5 days. RELN (red), TUJ1 (cyan), or DAPI (blue) for CR neurons, neurons, and nucleus, respectively. Scale bar, 50 μm. (B-G) Overexpression of CR-specific lncRNA Ln-CR1 significantly increased CR neurons number, promoted NSC differentiation, generated more neuron-like small cell clones and also increased cell apoptosis. Caspase3 (green), DAPI (blue) for apoptotic cells (arrowheads) and nucleus, respectively. Scale bar, 20 μm. All the experiments were performed at least 3 times, and 6 randomly selected microscopy fields were counted each time. Data represented mean ± SEM. P values indicated were calculated by Student’s t test (unpaired). **p<0.01, *p<0.05. (H) Quantification of process branch depth, branch levels, total dendrites length and soma size of CR neurons after overexpression of CR-specific lncRNA Ln-CR1 compared to control. All the experiments were performed 3 times, and 8 randomly selected microscopy fields were counted each time. Data represented mean ± SEM. p values indicated were calculated by Student’s t test (unpaired). **p<0.01, *p<0.05. (I-J) Immunostaining of neural cells treated with control (CAG-control) or overexpression lentiviruses for CR-specific lncRNA Ln-CR1 (CAG-Ln-CR1) after in vitro culture for 5 days shown more mature neurons in Ln-CR1 overexpression group. PSD-95 (magenta), DAPI (blue) for mature neurons and nucleus, respectively. Scale bar, 10 μm. The experiments were performed at least 3 times, and 6 randomly selected microscopy fields were counted each time. Data represented mean ± SEM. P values indicated were calculated by Student’s t test (unpaired). *p<0.05. (K) Quantification expression level of CR neuron molecular markers as Reln, Ebf2, and Calb2 at 72h after lentiviral transduction in the NSC culture assay comparing the effects of overexpression of Ln-CR1 to control. Data represented mean ± SEM (***p<0.001, **p<0.01, n>3, Student’s t test (unpaired)). (L) Comparison of dendritic spine, filopodia and processes in cortical wholemounts overexpressing Ln-CR1 (CAG-Ln-CR1) to CAG-control. Scale bar, 20 μm. Ebf2-EGFP+ cortical wholemounts were collected from P3 pups after in utero electroporation to cerebral cortex layer 1 on E15.5.

