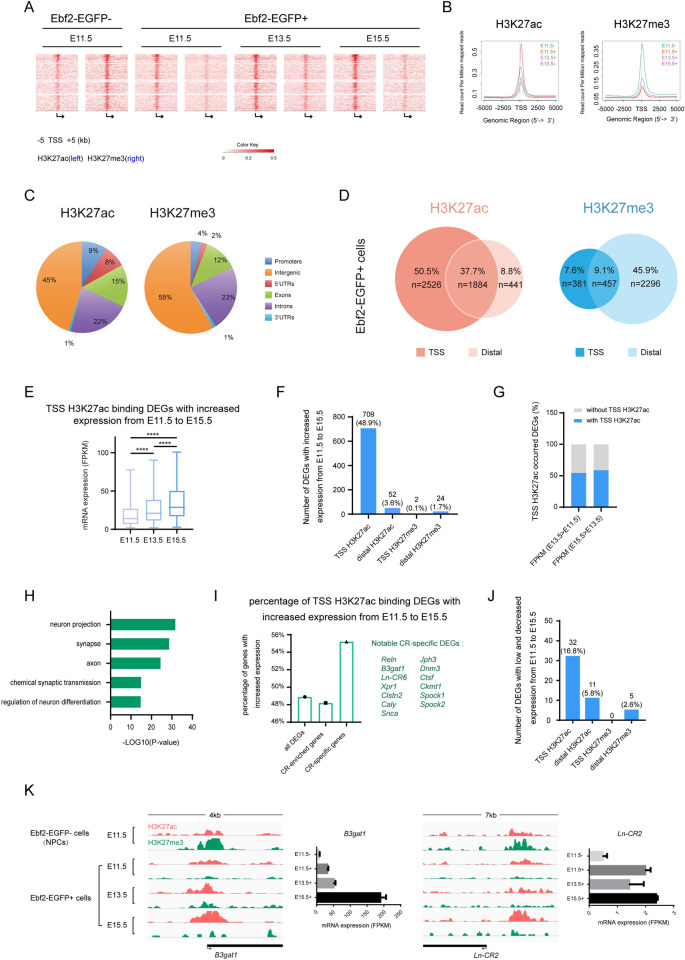
Fig 6. Genomic features of H3K27ac and H3K27me3 histone modification in the early differentiating neurons.
(A) Heatmap representation of ChIP-seq signal density for H3K27ac and H3K27me3 for 10 kb centered on predicted gene TSSs in Ebf2-EGFP- cells (E11.5) and Ebf2-EGFP+ cells (E11.5, E13.5 and E15.5), respectively. (B) A profile plot showing normalized H3K27ac (left) or H3K27me3 (right) enrichments around TSS of all detected genes in Ebf2-EGFP- cells (E11.5) and Ebf2-EGFP+ cells (E11.5, E13.5 and E15.5), respectively. (C) Genomic features of H3K27ac and H3K27me3-bound genes in Ebf2-EGFP+ cells. (D) Proportion of TSS and distal H3K27ac, H3K27me3 bindings distributed in DEGs in Ebf2-EGFP+ cells, respectively. (E) mRNA expression (FPKM) of DEGs with H3K27ac signals around TSS region from E11.5 to E15.5. Data represent mean ± SEM, N = 334 genes, independent experiments, ****P<0.0001, T-test. (F) The number of DEGs that steadily increase expression level from E11.5 to E15.5 with TSS and distal region H3K27ac, H3K27me3 occupancies in Ebf2-EGFP+ cells. The percentage indicate the proportion of all E11.5 to E15.5 expression increased DEGs (with and without histone modification). Chi-square test showing the significant correlation between H3K27ac signals in the gene TSS regions and gene expression, P<0.01. (G) Percentage of DEGs that steadily increase expression level from E11.5 to E13.5, E13.5 to E15.5, with (blue) or without (grey) TSS H3K27ac enrichments, respectively, in the Ebf2-EGFP+ cell populations, that is, during CR neuron differentiation progression. (H) Functional GO analysis for those TSS H3K27ac binding DEGs in Ebf2-EGFP+ cells with steadily increased expression level from E11.5 to E15.5. Genes for analysis derived from Fig 6G. (I) Percentage of gene number (DEGs, CR-enriched DEGs and CR-specific DEGs) with positive correlation between expression (FPKM) and H3K27ac signals in the gene TSS region. Notable CR-specific genes are listed. (J) The number of DEGs that lowly expressed (FPKM<1) and steadily decreased expression level from E11.5 to E15.5 with TSS and distal region H3K27ac, H3K27me3 occupancies in Ebf2-EGFP+ cells. The percentage indicate the proportion of all E11.5 to E15.5 low and decreased expression DEGs (with and without histone modification). (K) The TSS regions of CR-specific genes B3gat1, and CR-specific lncRNAs Ln-CR2 demonstrate a similar pattern of histone modification during early embryonic development (bivalent in NPCs and become more activated with monovalent H3K27ac in Ebf2-EGFP+ cells from E11.5 to E15.5).

