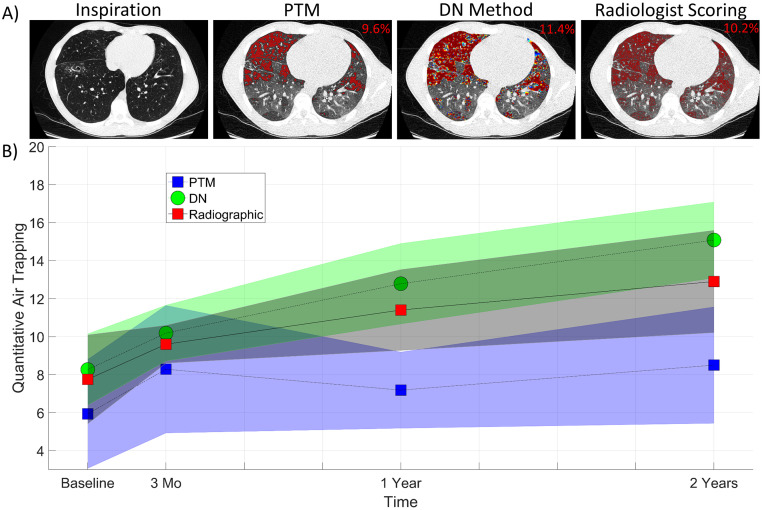
Fig 4.
A) Presented from a single case from the Site 2 cohort examined at 3 months are representative images from A) the inspiratory CT scan and the AT maps from the personalized threshold method (PTM), the DN method, and radiographic assessment by a trained radiologist. The QAT for the whole 3D dataset is provided on the top right corner of each 2D image. The images are windowed between [–950, 150] for display purposes so that regions of AT are visible. B) Quantitative air trapping (QAT) at different times by the various methods on the Site 2 cohort.

