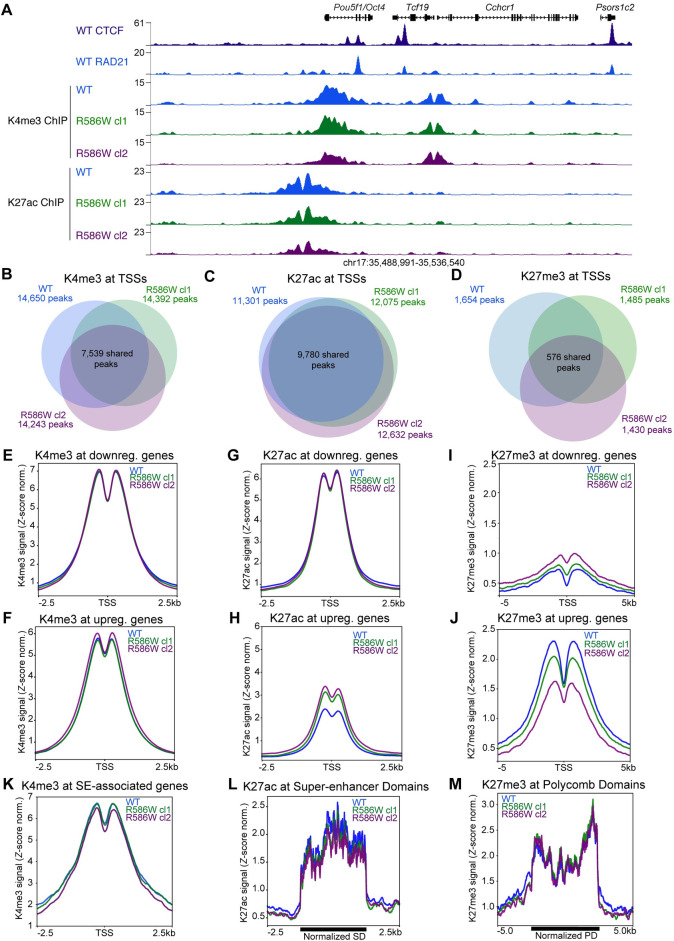
Fig 2. Active histone markings at promoters and enhancers are similar between wildtype and SMC1A-R586W mESCs.
A UCSC Genome Browser coverage tracks showing K4me3 and K27ac distribution at the Pou5f1 (Oct4) locus in mESCs. CTCF data were previously published [68]. B Overlap of K4me3-marked TSSs, C K27ac-marked TSSs, and D K27me3-marked TSSs in wildtype and SMC1A-R586W mESCs. E K4me3 signal at the TSSs of genes downregulated and F upregulated in SMC1A-R586W mESCs. G K27ac signal at the TSSs of genes downregulated and H upregulated in SMC1A-R586W mESCs. I K27me3 signal at the TSSs of genes downregulated and J upregulated in SMC1A-R586W mESCs. K K4me3 signal at TSSs of Super-enhancer associated genes. L K27ac signal at Super-enhancer Domains. M K27me3 signal at Polycomb Domains identified by Dowen et al. (2014). K4me3 and K27me3 data represents merge of two biological replicates for each group. K27ac data shown represents merge of three biological replicates of wildtype and two each of SMC1A-R586W clone 1 and SMC1A-R586W clone 2.

