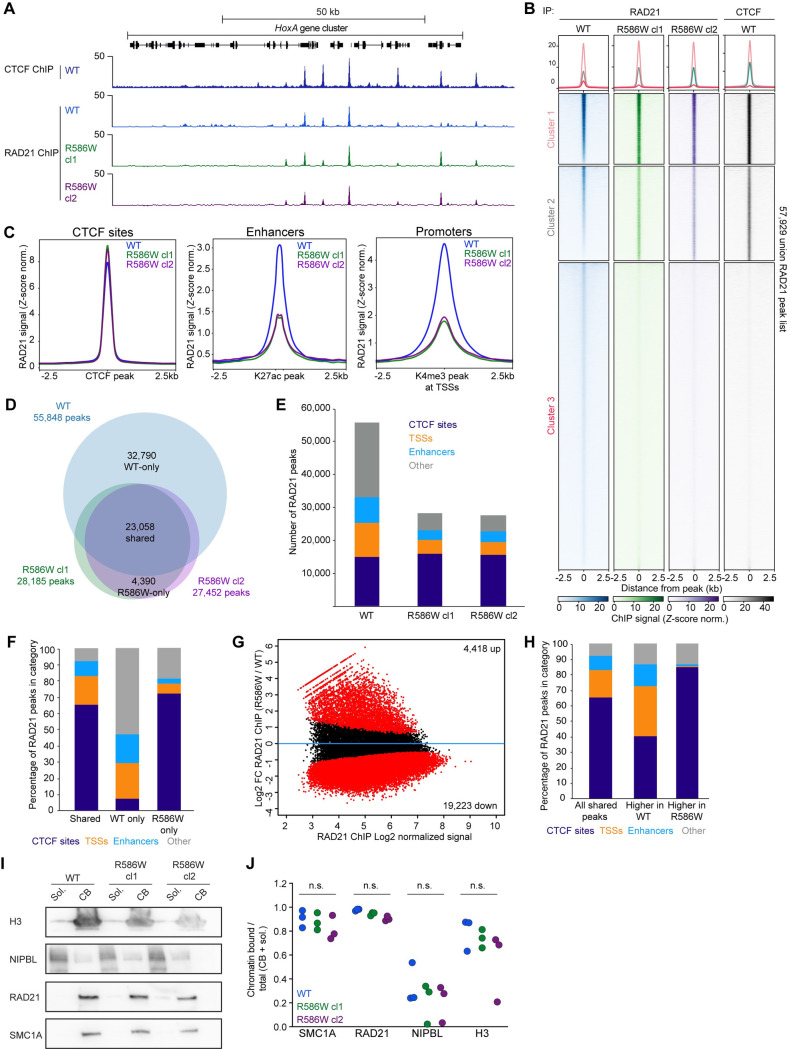
Fig 3. Cohesin is selectively depleted at promoters and enhancers in SMC1A-R586W mESCs.
A RAD21 enrichment measured by ChIP-seq at the HoxA locus in wildtype and R586W cl1 and cl2. B Heatmap representation of RAD21 and CTCF enrichment, with k-means clustering. Rows are ranked in descending order based on WT RAD21 signal (column 1). C Average signal plots depicting RAD21 enrichment at CTCF sites, a merged list of K27ac peaks (enhancers), and a merged list of K4me3-marked TSSs (promoters) in wildtype and R586W cl1 and cl2. D Overlap of called peaks in wildtype and R586W cl1 and cl2. E Distribution of RAD21 peaks across the given genomic sites in wildtype and R586W mESCs. F Distribution of RAD21 peaks common to both R586W clones but not wildtype mESCs. G Differential analysis using Diffbind of RAD21 signal at peaks common to wildtype and both R586W clones. Red, p-adj<0.1. H Distribution across given genomic sites of peaks with increased or decreased signal in R586W mESCs as measured by Diffbind. For analyses shown, data from 2 biological replicates for each of wildtype, R586W cl1, and R586W cl2 were merged. I Representative western blots showing the levels of indicated proteins in soluble (Sol.) and chromatin-bound (CB) fractions. J Amounts of chromatin-bound protein expressed as a fraction of total (chromatin-bound + soluble) signal for WT, R586W cl1, and R586W cl2. n = 3 biological replicates. All differences not significant as measured by two-way ANOVA. Numerical data are presented in S6 Table.

