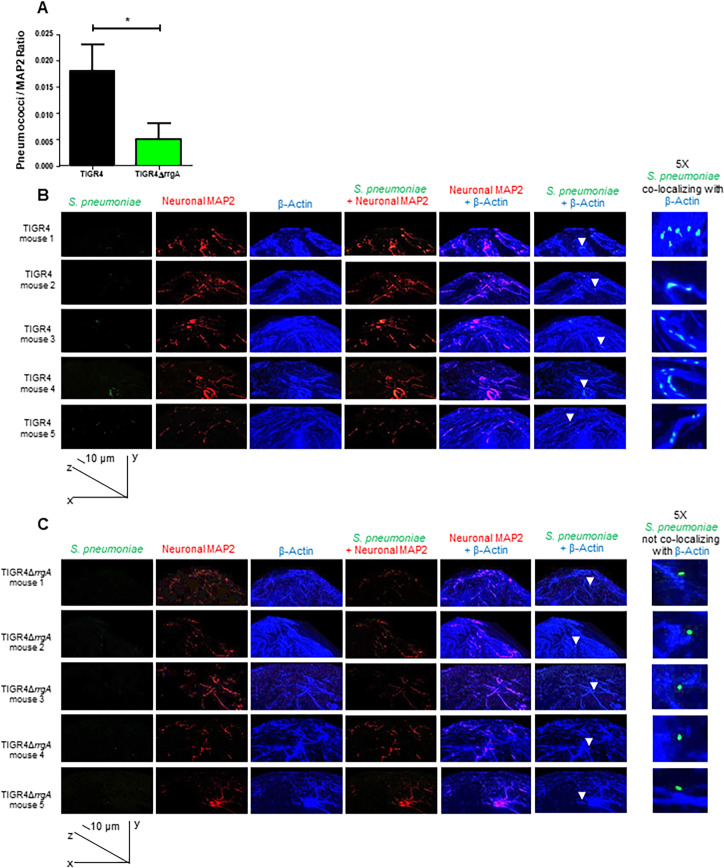
Fig 5. Mouse brain tissue ex vivo analyzed by high-resolution fluorescence microscopy and 3D reconstruction imaging showing that pneumococci associated with neurons co-localize with neuronal β-actin only when expressing RrgA.
Pneumococci were stained with anti-serotype 4 capsule antibody combined with goat anti rabbit Alexa Fluor 488 (green), neurons were stained with anti-MAP2 antibody labelled with Zenon labeling mouse IgG 594 fluorophore (red), β-actin was stained with anti-β-actin antibody combined with goat anti mouse Alexa Fluor 647 (far red, a blue color was assigned using the Softworx imaging software). High-resolution microscopy analysis and 3D reconstruction imaging (Volume viewer function of the Softworx imaging software) was performed to firstly detect pneumococci in the brain tissue of the mice co-localized with neurons, then to analyze the co-localization between pneumococci and β-actin, and analysis of β-actin with the neuronal marker MAP-2 to distinguish β-actin of neurons co-localization. (A) For quantifying the bacterial fluorescence signal on neurons, in each image the area occupied by the green fluorescence signal of the bacteria was divided by the area occupied by the red fluorescence signal of neurons, all areas were measured in square pixels and calculated with the software Image J; columns in the graph represent average values, error bars represent standard deviations, the Pneumococci/MAP2 ratio is shown on the Y axis; * = p<0.05. (B and C) At the bottom left corner of figures in panels B and C the graph shows the angle of the 3D reconstruction of each image (XYZ axes) and the scale bars; six tissue sections for each mouse (5 mice) infected with either TIGR4 (A) or TIGR4ΔrrgA (B) were imaged, and per each section twenty-five images in random regions of the section were taken. White arrows in the panel “S. pneumoniae + β-actin” point towards specific area of the tissue sections to highlight the co-localization between piliated pneumococci and β-actin (A), and the absence of co-localization between non-piliated pneumococci and β-actin (B); the panel “5X S. pneumoniae co-localizing with β-actin” displays the region of brain tissue in close proximity of the white arrows with an enhanced 5X magnification.

