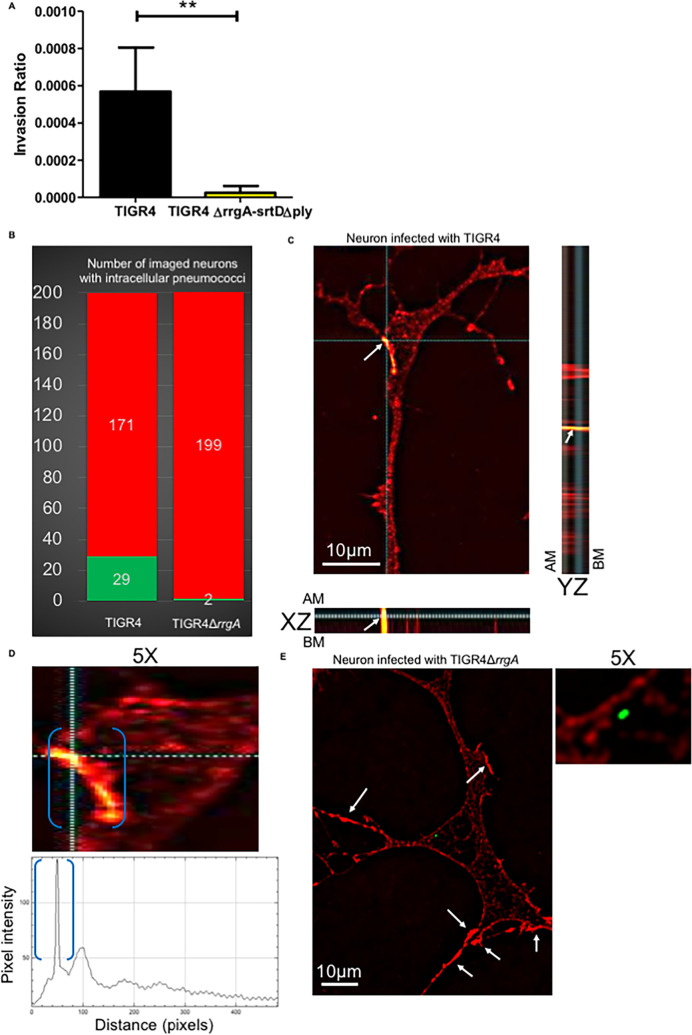
Fig 6. RrgA and Ply increase pneumococcal invasion of neurons and intracellular piliated pneumococci co-localize with neuronal β-actin.
(A) CFU-based internalization assay using wt TIGR4 and its isogenic double mutant TIGR4ΔrrgA-srtDΔply. The uptake ratio by neurons was calculated as [CFU of intracellular bacteria] / [CFU of adhered bacteria)]. In the graph, columns represent average values, and error bars represent standard deviations. The graph shows an overview of three biological replicates. ** = p<0.001. (B) High-resolution fluorescence microscopy analysis was performed of neurons with intracellular pneumococci that were fixed, and permeabilized. Immunofluorescence staining was performed to detect β-actin with an anti-β-actin antibody combined with goat anti mouse Alexa Fluor 594 (red) and pneumococci with anti-serotype 4 capsule antibody combined with goat anti rabbit 488 (green). The graph shows a quantification of the number of neurons with intracellular pneumococci among a total number of 200 random neurons imaged per strain, either TIGR4 or TIGR4ΔrrgA. The green column represents the number of neurons with intracellular pneumococci and the red column the number of neurons without intracellular pneumococci. (C) Neurons with intracellular pneumococci after TIGR4 infection were imaged with z-stacks to capture the thickness of the neuronal cell (number z-stacks = 22). Intracellular pneumococci with the z-stack number = 9 was displayed from top view and in XZ-axes- and YZ-axes-orthogonal views to demonstrate intracellular localization of pneumococci (green). The imaged bacteria were within the neuronal cell thickness between the AM (apical membrane) and BM (basolateral membrane). Both XZ and YZ-axes-orthogonal views showed co-localization between pneumococci (white arrows) and intracellular β-actin. The image shown is a representative of 200 neurons imaged after TIGR4 infection. (D) 5X magnification of the neuron shown in Fig 6B focusing on the cell area in close proximity to intracellular pneumococci. The function Profile Plot of Image J was used to measure the intensity (pixels) of the red fluorescence signal of β-actin. Within blue brackets the β-actin staining in close proximity to intracellular pneumococci that corresponds to the pick of fluorescence intensity in the graph underneath the microscopy image is shown. (E) Neurons with intracellular pneumococci after TIGR4ΔrrgA infection were imaged with z-stacks to capture the thickness of the neuronal cell (number z-stacks = 22). The displayed image shows the z-stack number = 10; white arrowns point towards regions of the neuronal cell with a localized enhanced β-actin fluorescent signal. The panel “5X” shows the same image 5X magnified focusing on the area of neuronal cell in close proximity to the intracellular bacteria to highlight the absence of co-localization between TIGR4ΔrrgA and intracellular β-actin. This image is a representative of 200 neurons imaged after TIGR4ΔrrgA infection.

