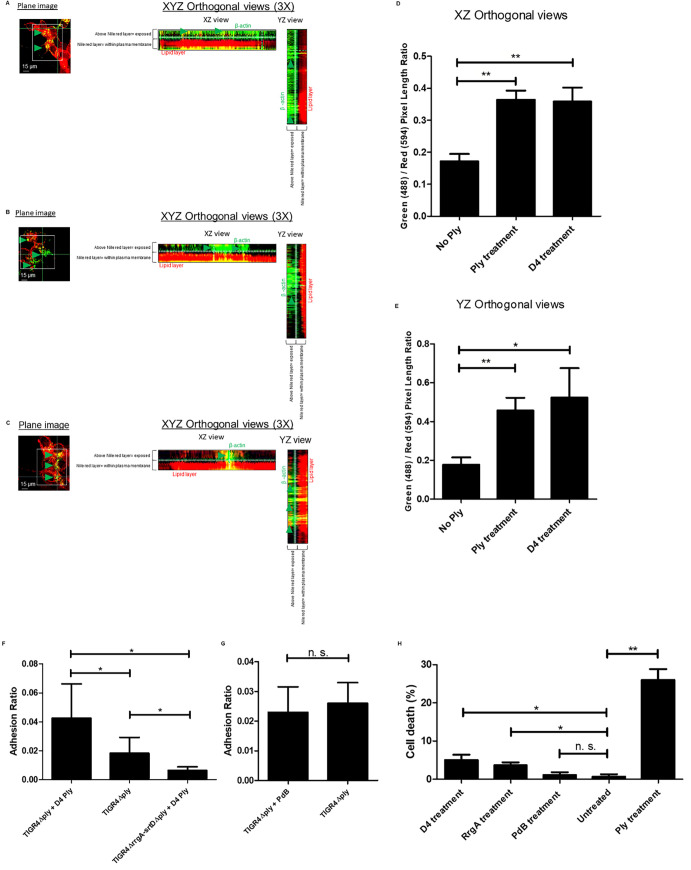
Fig 8. Treatment with purified Ply and D4 enhance exposure of β-actin on the neuronal plasma membrane.
Immunofluorescence microscopy analysis showing fixed and non-permeabilized neurons pre-treated with purified Ply (A), D4 (B), or untreated (C), same figure shown in Fig 5A), and stained for the detection of plasma membrane lipids (nile red) and β-actin; 3D-orthogonal views were used to visualize the portions of neuronal cells with β-actin signal above the nile red staining (= exposed on plasma membrane); per each experimental group, n = 200 neurons (among two different biological replicates) were imaged. (D and E) Quantification graphs showing the amount of β-actin signal exposed on the plasma membrane assessed by measuring the length (pixels) of the β-actin signal detected above the nile red staining; Y axis displays Green (488 nm channel) / Red (594 nm channel) ratio that was calculated by dividing the length (pixels) of the β-actin signal (green) detected above the nile red signal (red) by the length of the nile red signal; measurement of the length values (pixels) was performed with the function of Image J Analyze/Plot Profile; bars and error bars in the graphs represent average and standard deviation values calculated among 200 neuronal cells imaged for each experimental group, ** = p<0.01, * = p<0.05 (F) Adhesion of TIGR4Δply to untreated and D4-treated neurons and of TIGR4ΔrrgA-srtDΔply to D4-treated neurons was calculated by dividing the total number of bacteria in each well for each pneumococcal strain after pneumococcal infection by the total number of adhered bacteria in each well for each pneumococcal strain. Columns represent average values, and error bars represent standard deviations; the graph shows data from n = 2 biological replicates (with n = 7 and n = 5 technical replicates per each biological replicate), * = p<0.05. (G) Adhesion of TIGR4Δply to untreated and PdB-treated neurons was calculated by dividing the total number of bacteria in each well for each pneumococcal strain after pneumococcal infection by the total number of adhered bacteria in each well for each pneumococcal strain. Columns represent average values, and error bars represent standard deviations; the graph shows data from n = 3 biological replicates (with n = 3 and n = 3 technical replicates per each biological replicate), * = p<0.05. (H) Neuronal cell death measured by LDH release in neurons treated with D4, or RrgA, or mutant toxoid PdB, or full Ply, non-treated neurons were used as control; columns represent average values, and error bars represent standard deviations; the graph shows data from n = 2 biological replicates (with n = 3 technical replicate per each biological replicate), ** = p<0.01, * = p<0.05.

