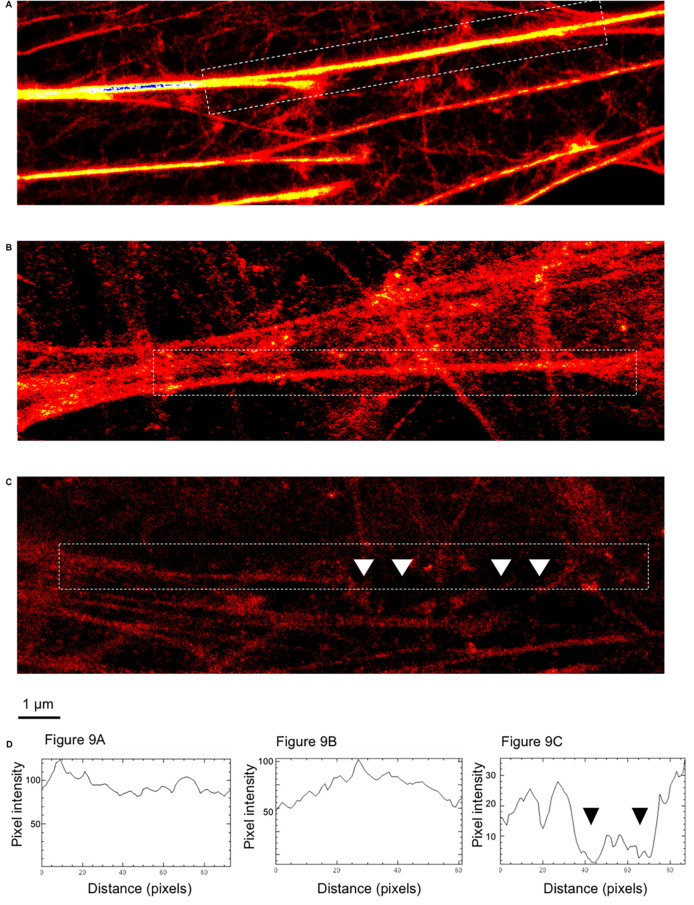
Fig 9. Disruption of neuronal β-actin filaments imaged by STED super-resolution microscopy.
Immunofluorescence STED super-resolution microscopy analysis showing β-actin filaments (red) within neurons uninfected (A), infected with TIGR4ΔrrgA-srtDΔply (B) and TIGR4 (C). (D) Intensity profiles of the β-actin filaments selected within white dashed rectangles; fluorescent intensity profile measurement performed with the function of Image J Analyze/Plot Profile. the intensity profiles shown in D are representatives of the whole imaging experiment (for each experimental group, 25 neuronal cells were imaged). White arrows in C point towards gaps of β-actin filaments that correspond to the drop of fluorescent intensity measured in the intensity profile graph (black arrows, third graph from the left).

