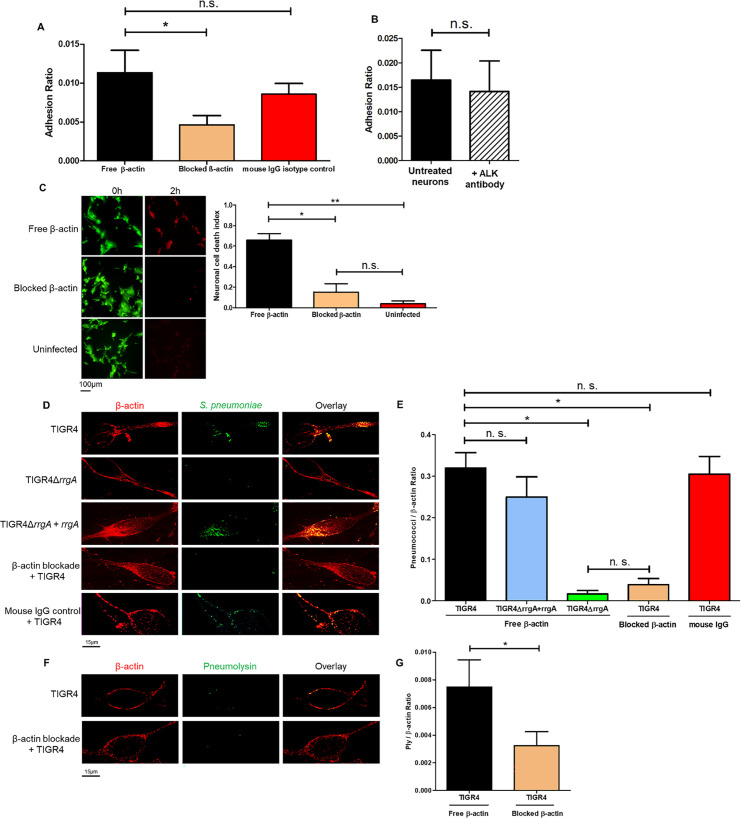
Fig 10. Blockade of β-actin on the plasma membrane with antibodies inhibit interactions with the cytotoxin Ply.
CFU-based adhesion assays were performed using wt TIGR4 bacteria and in (A) untreated neurons, anti-β-actin-antibody-treated neurons and mouse-IgG-treated neurons, and in (B) untreated neurons and anti-ALK-antibody-treated neurons. The adhesion ratio was calculated as [CFU of adhered bacteria] / [CFU of (non−adhered bacteria + adhered bacteria)]. The columns represent average values, and error bars represent standard deviations. The graph shows an overview at three biological replicates. * = p<0.05, n.s. = non-significant. (C) Images from the live-cell imaging experiment at the start (0 h) and at the end, 2 hours post infection, and related quantification of neuronal cell death. Differentiated neurons were stained with a live/dead dye expressing green fluorescence for live cells and red fluorescence when undergoing cell death. Ratio Green (488 nm) / Red (594 nm) represents the neuronal cell death index, calculated by dividing the total area occupied by the green fluorescence signal at time 0 by the total area occupied by the red fluorescence signal at 2 hrs (as performed for data shown in Fig 1). Per each condition with pneumococci, a total of four biological replicates were used, and a total of two biological replicates were used for uninfected neurons. Columns in the graphs represent average values, and error bars represents standard deviations. ** = p<0.001, * = p<0.05, n.s = non-significant. (D and F) Infected neurons were fixed and stained with anti-β-actin antibody combined with goat anti mouse Alexa Fluor 594 for the detection of β-actin, and with anti-serotype 4 capsule antibody combined with goat anti rabbit Alexa Fluor 488 (green) for the detection of pneumococci (D). Anti-Ply antibody combined with goat anti rabbit Alexa Fluor 488 (green) was used for detection of Ply (F). Each neuron imaged in D and F is representative of 200 neurons imaged per each pneumococcal strain. (E and G) Quantification analysis of the amount of pneumococcal signal detected on the plasma membrane of neurons by high-resolution microscopy. For quantification of the (E) pneumococcal or (G) Ply fluorescence signal on neurons, in each image (n = 200 neurons with adhered bacteria, per each pneumococcal strain) the area occupied by the green fluorescence signal of the bacteria or Ply was divided by the area occupied by the red fluorescence signal of β-actin. All areas were measured in square pixels and calculated with the software Image J. Columns in the graph represent average values, and error bars represent standard deviations. The Pneumococci/ β-actin ratio is shown on the Y axis; * = p<0.05, n.s. = non-significant.

