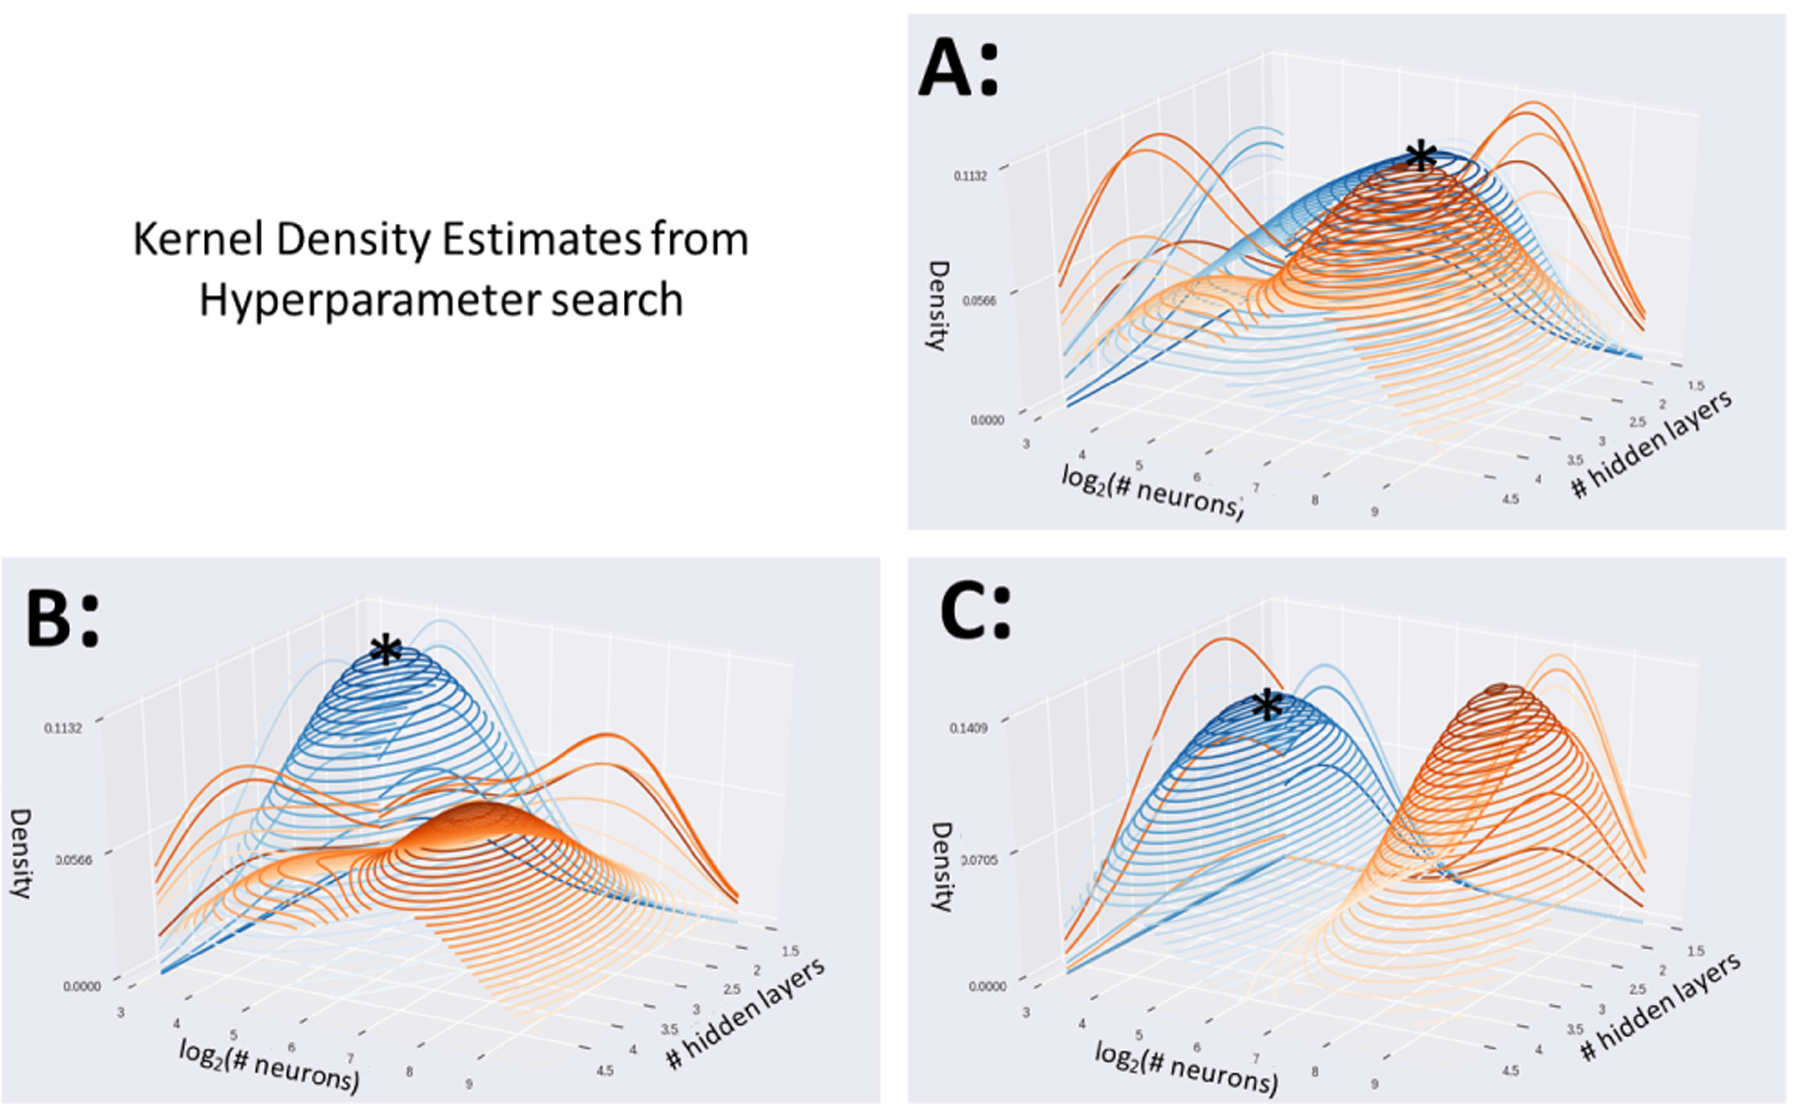
Fig. 2.

Kernel Density Estimates from the hyperparameter search reveals the density of top performing configurations (top 20%) shown in blue, and low performing configurations (bottom 20%) in orange. Densities of DenseFeedFwd configurations using the coarse BASC atlas (A), medium atlas (B), and fine atlas (C). Peaks of blue surfaces are marked with *.
