
Figure 4.
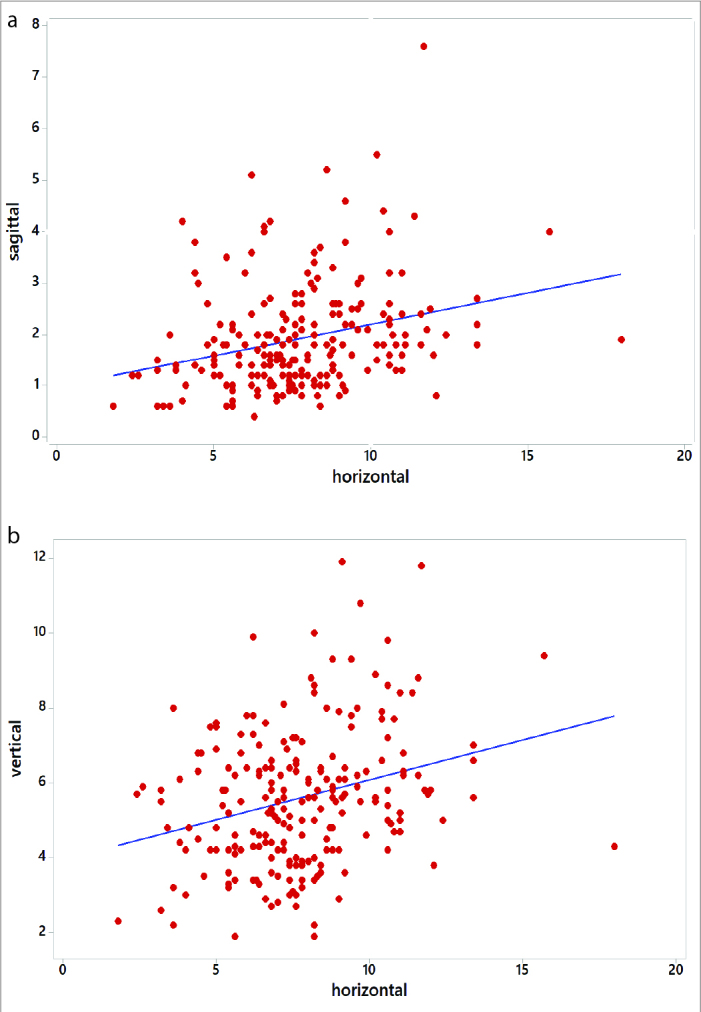
Graphs showing positive correlation between (a) sagittal and horizontal and (b) vertical and horizontal values in the pooled sample (men and women).
Official websites use .gov
A
.gov website belongs to an official
government organization in the United States.
Secure .gov websites use HTTPS
A lock (
) or https:// means you've safely
connected to the .gov website. Share sensitive
information only on official, secure websites.
Graphs showing positive correlation between (a) sagittal and horizontal and (b) vertical and horizontal values in the pooled sample (men and women).