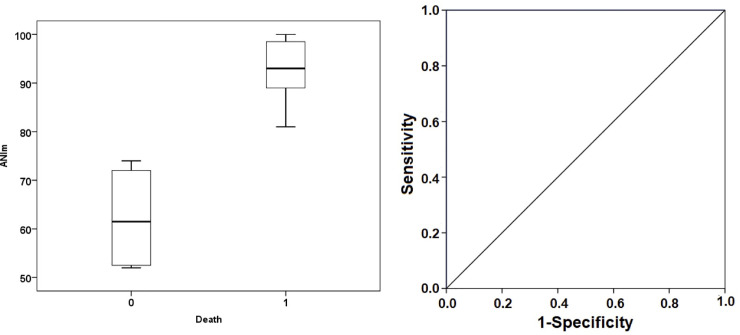
Fig 4. Sub-analysis: Box plot (left) and ROC curves for ANIm (right) in the RASS -4 / -5 patients.
Box plot represents the median values of ANIm in both groups. ROC curve demonstrates the ability of ANI to discriminate the mortality with an AUC = 1 at an ANIm threshold of 80 (sensitivity 100%, specificity 100%, positive predictive value 100%, negative predictive value 100%). ANIm, median analgesia nociception index; 0 death, survivor group; 1 death, non-survivor group.

