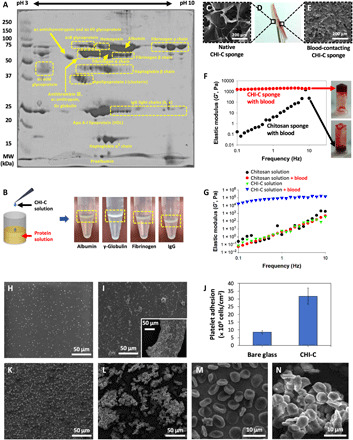
Fig. 2. Characterization of the BpB membrane.

(A) A photographic image of 2D acrylamide gel (12%) showing the plasma proteins that interacted with CHI-C to form BpB membranes. (B) Left: A schematic illustration of the experiment to confirm BpB membrane formation by CHI-C in each identified plasma protein solution. Right: Photographic images of BpB membranes formed by CHI-C in each protein (albumin, ɣ-globulin, fibrinogen, and IgG) solution. Photo credit: Keumyeon Kim, KAIST and InnoTherapy Inc. (C to E) Photographic images of the CHI-C sponge after contact with heparin-treated human blood (D) and SEM images of the native (photo credit: Ji Hyun Ryu, Wonkwang University) (C) and blood-contacting (E) surfaces of the CHI-C sponge. (F) Elastic modulus (G′) values of the CHI-C sponge (red circles) and chemically unmodified chitosan sponge (black circles) after mixing with heparin-treated human blood. Photographic images of test-tube inverting test results of CHI-C sponge (top photo) and chemically unmodified chitosan sponge (bottom photo) after mixing with heparin-treated human blood. Photo credit: Ji Hyun Ryu, Wonkwang University. (G) Changes in the mechanical properties (elastic modulus, G′) of CHI-C and chemically unmodified chitosan solutions after mixing with heparin-treated human blood. (H to J) SEM images of platelets adhered to bare glass surface (H) and CHI-C film (I) (large panel, mild and small panel, severe). (J) Quantification of platelet adhesion on the glass substrates and CHI-C films. (K to N) SEM images of red blood cells (RBCs) that adhere onto bare glass (K and M) and CHI-C film (L and N).
