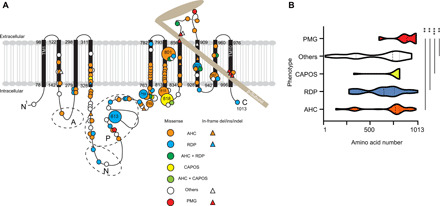
Fig. 3. Previously reported and newly identified ATP1A3 variants in a schematic of Na+/K+ ATPase α3-subunits and variant distribution among the phenotypes.

(A) The black bars represent transmembrane domains (TM1 to TM10), while the lines represent the intracellular and extracellular domains of the Na+/K+ ATPase α3-subunit. A hatchet-shaped light brown structure depicts the β-subunit. The symbols and colors used for explaining variants are described in the legend. Numbers indicate the residue number at each site. A, N, and P stand for the actuator, nucleotide binding, and phosphorylation regions, respectively. Large circles represent the commonly observed variants. (B) Graph of nontruncating variant distribution of AHC, RDP, CAPOS, others, and polymicrogyria. X axis: amino acid number; y axis: each phenotype. Dashed and dotted lines indicate the median and quartile, respectively. **P < 0.01 and ***P < 0.001 using the Kolmogorov-Smirnov test. PMG, polymicrogyria; others: phenotypes other than AHC, CAPOS, RDP, and polymicrogyria, including developmental and epileptic encephalopathy, such as EIEE with or without apnea, relapsing encephalopathy with cerebellar ataxia, or fever-induced paroxysmal weakness and encephalopathy.
