
Fig. 4. Functional consequences of the identified ATP1A3 variants.
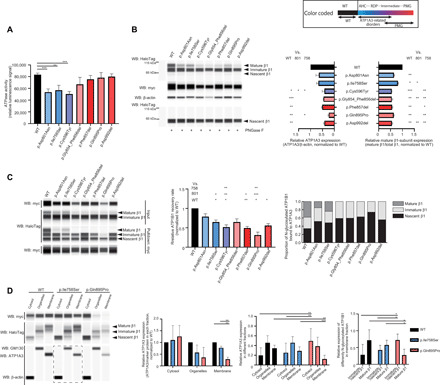
Black, blue, and purple/red bars indicate the wild-type (WT), AHC/RDP-associated, and polymicrogyria-associated variants, respectively. The upper right box shows color-coded information. Error bars, means ± SD. *P < 0.05, **P < 0.01, and ***P < 0.001. (A) ATPase activity in COS-7 cells. N = 3. (B) Expression of myc-tagged ATP1A3 and HaloTag-fused ATP1B1 in human embryonic kidney (HEK) 293T cells. Left: A representative blot. Right: The relative ATP1A3 and mature β1-subunit expression, normalized to the wild type. N = 3. WB, Western blot. (C) Coimmunoprecipitation of myc-tagged ATP1A3 and HaloTag-fused ATP1B1 in HEK293T cells. Left: A representative blot. Middle: The relative ATP1B1 recovery rate. N = 3. Right: The proportion of N-glycosylated ATP1B1 bound to ATP1A3. (D) The total HEK293T cell components cotransfected with ATP1A3 (wild type, p.Ile758Ser, or p.Gln895Pro) and ATP1B1 cDNA vectors were separated into three fractions: cytosol, organelles, and plasma membrane. Left: A representative blot. A dashed rectangle denotes Western blotting on a different cartridge. The second panel from the left: The relative ATP1A3 expression in respective fraction. N = 3. The second panel from the right: The proportion of ATP1A3 in each fraction for respective condition. N = 6. Right: The relative expression of differently N-glycosylated ATP1B1 in the plasma membrane fraction. N = 6.