
Fig. 5. Colocalization of ATP1A3 and ATP1B1 at the cis-/trans-Golgi apparatus and plasma membrane.
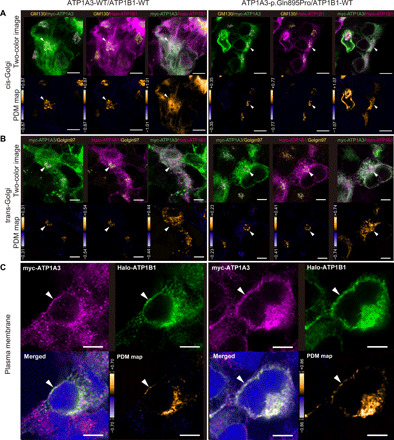
Through (A) to (C), the left and right panels show immunofluorescence under the cotransfection of wild-type ATP1A3 and wild-type ATP1B1 plasmids and p.Gln895Pro ATP1A3 and wild-type ATP1B1 plasmids, respectively. Scale bars, 5 μm. (A) ATP1A3 and ATP1B1 colocalizing at the cis-Golgi network in both panels (arrowhead). (B) ATP1A3 and ATP1B1 colocalizing at the trans-Golgi network in both panels (arrowhead). (C) ATP1A3 and ATP1B1 colocalizing at the plasma membrane in both panels (arrowhead). For (A) and (B), lower images are the pseudocolored maps of the product of the differences from the mean analysis (PDM maps) for the respective upper images. For (C), lower right panels are the PDM maps for the upper two images. In the PDM maps, positive correlation is indicated in yellow, negative correlation in blue, and random distribution in black.