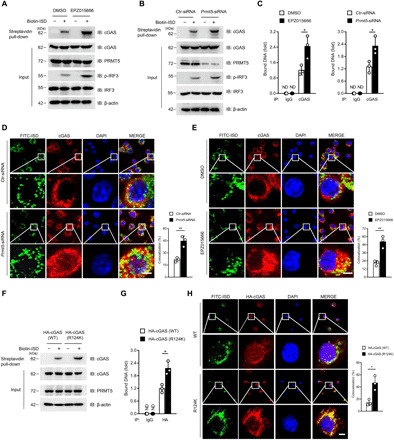
Fig. 5. Dimethylation of cGAS inhibits its DNA binding ability.

(A and B) Immunoblot analysis of ISD-bound cGAS by biotin-ISD pull-down performance in EPZ015666-treated BMDMs (A) or Prmt5-siRNA–transfected BMDMs (B). (C) Quantitative PCR analysis of the cGAS-bound DNA after IP of cGAS in the EPZ015666-pretreated BMDMs (left) or Prmt5-siRNA–transfected BMDMs (right) with further transfection with ISD for 6 hours. (D and E) Confocal microscopy assay of the colocalization of cGAS and FITC-ISD in Prmt5-siRNA–transfected BMDMs (D) or EPZ015666-treated BMDMs (E). The nucleus was stained with DAPI (blue), and the colocalization of cGAS (red) and ISD (green) was visualized as yellow fluorescence in the merged panel. Colocalization ratios of cGAS and FITC-ISD were analyzed by Manders’ coefficient values. (F and G) ISD-bound cGAS (F) and cGAS-bound DNA (G) after the biotin-ISD pull-down performance in cGAS(WT)- or cGAS(R124K)-transfected HEK293T cells were analyzed by immunoblotting and quantitative PCR, respectively. (H) Confocal microscopy analysis of the colocalization of cGAS and FITC-ISD in cGAS(WT)- or cGAS(R124K)-transfected HEK293T cells. Scale bars (bottom right), 10 μm. Statistical analysis was done with Student’s t test (n = 3 mice per group, and dots represent the mean value per mouse). *P < 0.05, **P < 0.01. Data are representative of three independent experiments with similar results [means ± SD in (C) to (E), (G), and (H)].
