
Fig. 5. Impact of PfICM1 disruption on the schizont phosphoproteome.
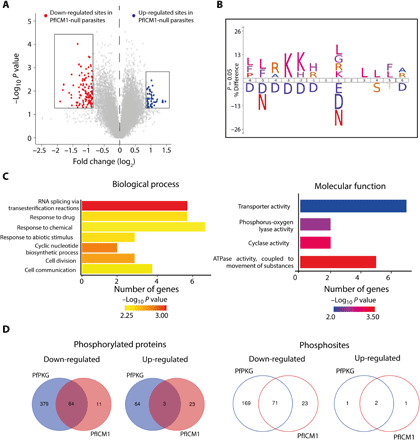
(A) Volcano plot showing distribution of phosphopeptide abundance in the presence or absence of PfICM1. Red circles correspond to significantly down-regulated peptides and blue circles to significantly up-regulated peptides. A cutoff of Welch difference of <−0.875 and >0.875 with P <0.05 and a localization probability of >0.7 represent significantly regulated peptides. (B) Motif analysis of the significantly down-regulated phosphosites in PfICM1-null parasites. All detected phosphopeptides were used as the reference dataset, with amino acids below the position line indicating residues unfavored for this position. Position 0 corresponds to the phosphorylated residue. (C) GO enrichment analysis of biological process and molecular function for proteins significantly hypophosphorylated in PfICM1-null parasites. Enriched terms with P < 0.01 are shown. (D) Venn diagram showing the number of phosphoproteins and the corresponding phosphopeptides significantly deregulated by PfPKG and PfICM1.