Figure 1.
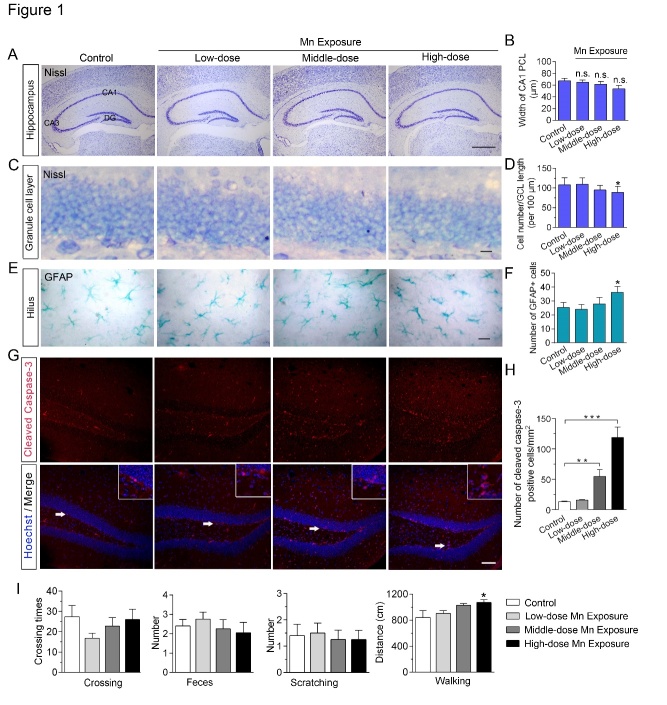
Effects of subchronic Mn exposure on mouse hippocampal morphology and locomotor behavior in the open field test. (A) Nissl staining of coronal brain sections reveals no differences in gross morphology of the hippocampus between Mn-exposure mice and their controls. DG, dentate gyrus. Scale bar, 300 μm. (B) Quantitative analysis of neuronal density in mouse hippocampal CA1 area after Mn exposure. PCL, pyramidal cell layer. (C) Representative Nissl staining of the granule cell layer (GCL) in the hippocampal DG. Scale bar, 15 μm. (D) Statistical analysis of cell numbers in the GCL of control and Mn-exposed mice. (E) Representative immunohistochemistry images of astrocytic glial fibrillary acidic protein (GFAP) immunoreactivity in the hilus of the mouse hippocampus. Scale bar, 15 μm. (F) Quantification of the number of astrocytes in control and Mn-exposed mice. (G) Immunofluorescent labeling of cleaved caspase-3 in brains of control and Mn-exposed mice. Hoechst staining was used to label the DNA in the cell nuclei. Magnification of the areas pointed to by the arrows is shown in the upper right corner of each panel. Scale bar, 60 μm. (H) Quantitative analysis of activated caspase-3-positive cells in mouse hippocampal area after Mn exposure. n = 4-6 in each group. (I) The histograms show quantitative analysis of locomotor activity of Mn-treated mice and their controls in the open field test. n = 7 in each group. Error bars represent means ± SEM. *P < 0.05, ** P < 0.01, *** P < 0.01 vs control; data are analyzed by one-way ANOVAs with post hoc Dunnett’s tests.

