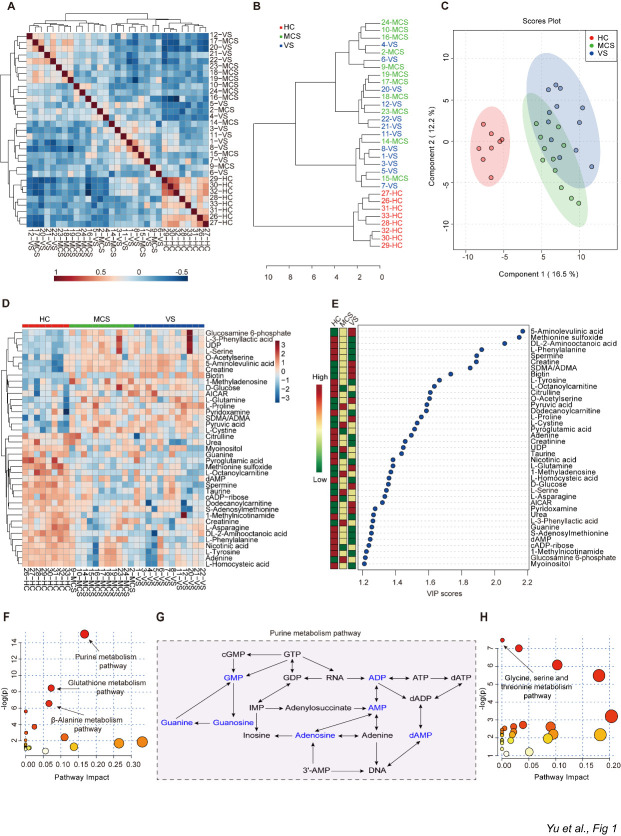
Figure 1.
Metabolites responsible for distinguishing HC, MCS and VS groups. A) The heatmap of the correlation coefficients of the HC, MCS, and VS groups. B) Dendrogram of the three groups (HC, MCS, and VS) to show the clustering of all 31 samples. C) Principal component analysis of the plasma metabolome from three groups. D) Heatmap of the most abundant metabolites in three groups, as identified by VIP scores in PLS-DA. Each sample represents a single column. Red color indicates the greater abundance of metabolite. PLS-DA: partial least-squares discriminant analysis; VIP: variable importance in projection. E) Top 39 metabolites in plasma based on VIP scores for differentiating among HC, MCS, and VS groups. The colored boxes on the right indicate the relative concentrations of the corresponding metabolite in each group. F) A summary of pathway analysis using down-regulated metabolites in MCS and VS groups when compared to HC group. The size of the circle represents the pathway impact and the color represents the P value. Smaller P values and larger pathway impact indicate higher influential pathways. -log(p) = minus logarithm of the P value. G) A part of purine metabolism pathway in HC, MCS, group and VS groups. Metabolites in blue decreased in MCS group and VS group compared to HC group. H) A summary of pathway analysis using up-regulated metabolites in MCS group and VS group compared to HC group. HC: healthy controls; VS: vegetative state; MCS: minimally conscious state.

