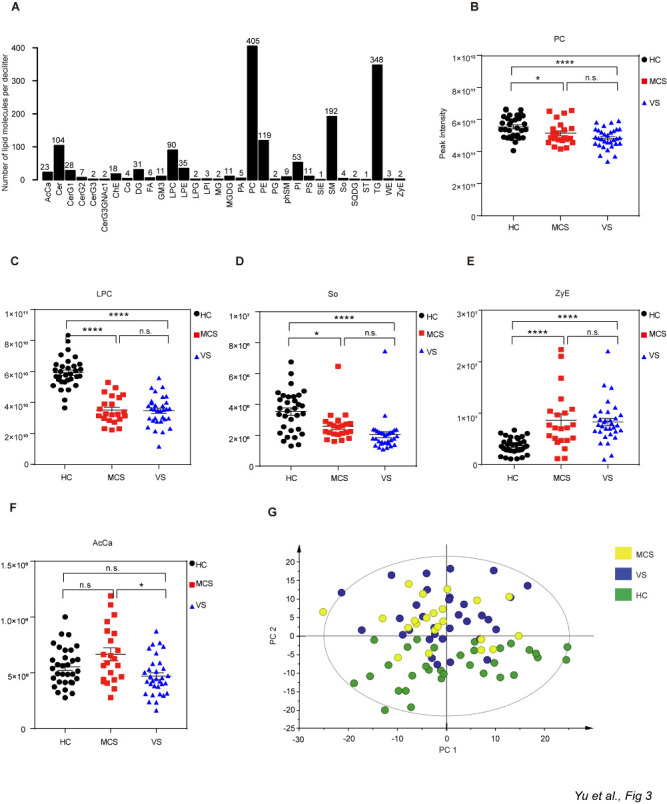
Figure 5.

Preliminary analysis of lipids. A) Subclasses of serum lipids. B-F) Difference analysis for certain lipid subclasses between the VS and MCS groups and the HC group. Data represent as the mean ± SEM; *P<0.05, **P<0.01, ****P<0.0001, n.s.: no significant difference, one-way ANOVA. G) Principal component analysis (PCA) score plot. AcCa: acyl carnitine; PC: phosphatidylcholine; LPC: lysophosphatidylcholine; PE: phosphatidylethanolamine; LPE: lysophosphatidylethanolamine; PS: phosphatidylserine; PI: phosphatidylinositol; LPI: lysophosphatidylinositol; PG: phosphatidylglycerol; LPG: lysophosphatidylglycerol; PA: phosphatidic acid; Cer: ceramides; CerG1-G3, CerG3GNAc1: simple Glc series; ChE: cholesterol ester; Co: coenzyme; DG: diglyceride; FA: fatty acid; GM3: gangliosides; MG: monoglyceride; MGDG: monogalactosyldiacylglycerol; phSM: phytosphingosine; SiE: sitosterol ester; SM: sphingomyelin; So: sphingosine; SQDG: sulfoquinovosyldiacylglycerol; ST: sulfatide; TG: triglyceride; WE: wax exters; ZyE: zymosterol; HC: healthy controls; VS: vegetative state; MCS: minimally conscious state.
