
Figure 6.
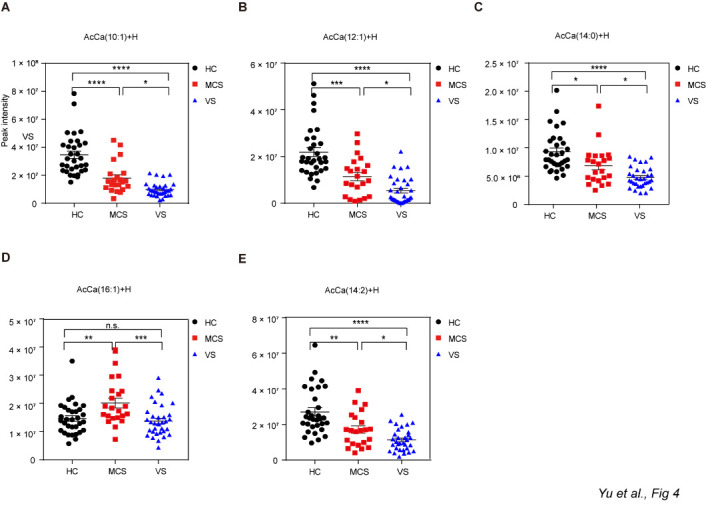
Different levels of AcCa among HC group, MCS group and VS group. Data represent as the mean ± SEM; *P<0.05, **P<0.01, ***P<0.001, ****P<0.0001, n.s.: no significant difference, one-way ANOVA. AcCa: acetylcarnitine; HC: healthy controls; VS: vegetative state; MCS: minimally conscious state; HC: healthy controls; VS: vegetative state; MCS: minimally conscious state.