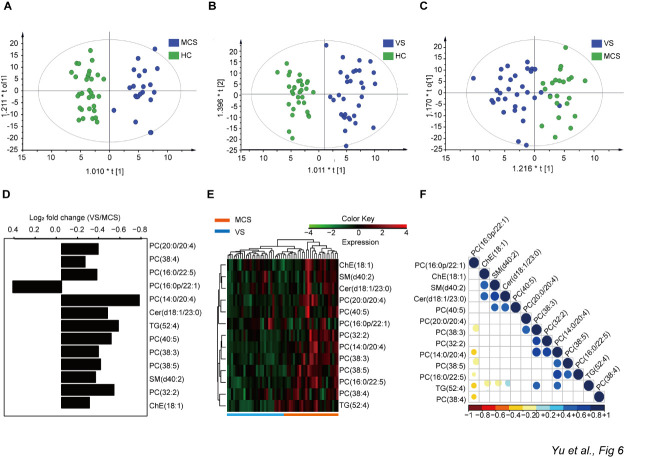
Figure 8.
Multivariate analysis and univariate analysis of lipids detected by untargeted lipidomics. A) Orthogonal partial least squares-discriminant analysis (OPLS-DA) score plot between the HC and MCS groups. B) OPLS-DA score plot between the HC and VS groups. C) OPLS-DA score plot between the VS and MCS groups. D) Fold change in the serum levels of various lipids in the VS group compared with the MCS group. E) Hierarchical clustering analysis indicating natural variations in lipid levels in the VS and MCS groups. F) Heat map that correlated with lipids in the VS and MCS groups; HC: healthy controls; VS: vegetative state; MCS: minimally conscious state.

