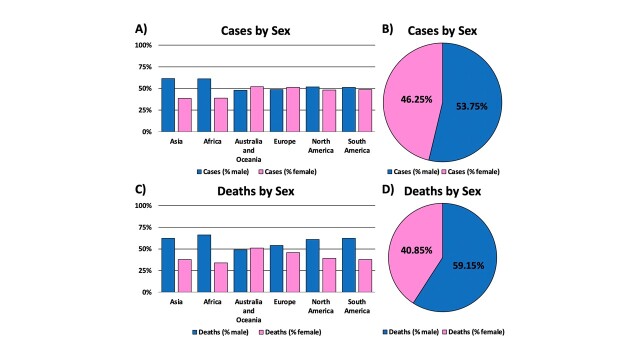
Figure 1.
Global mortality and sexual disparity of COVID-19 by continents. (A) Global COVID-19 cases by sex and continent (B) Pie chart representation of the percentage of COVID-19 cases by sex. (C) Global mortality rate of COVID-19 deaths by sex and continent. (D) Pie chart representation of COVID-19 death percentages by sex. Male data is represented in blue, while female data is represented by pink. Overall, data suggests that males have an increased risk for COVID-19 infection and death, when compared to female counterparts. Data was generated from Global Health 5050.org, on the 16th of November 2020.

