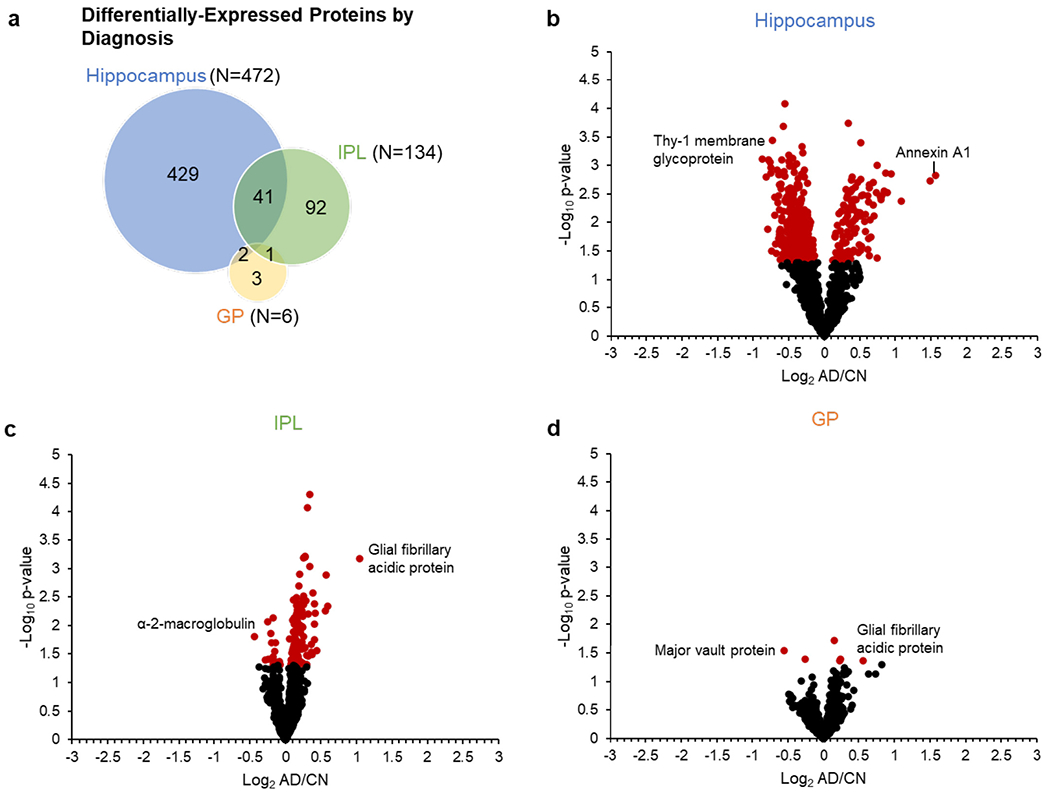
Fig. 2.

Differentially-expressed proteins by diagnosis in each region. a, Venn diagram showing the regional overlap in differentially-expressed proteins by diagnosis and corresponding volcano plots for b, hippocampus, c, IPL, and d, GP. CV-filtered quantified proteins are shown for each region (hippocampus N = 1338; IPL N = 1407; GP N = 1103). Red data points indicate differentially-expressed proteins with uncorrected p-value < 0.05; black data points indicate quantified proteins with nonsignificant p-values. Selected proteins with significant changes in AD are highlighted in each plot. Abbreviations: IPL, inferior parietal lobule; GP, globus pallidus; AD, Alzheimer’s disease; CN, cognitively normal. (For interpretation of the references to color in this figure legend, the reader is referred to the web version of this article.)
