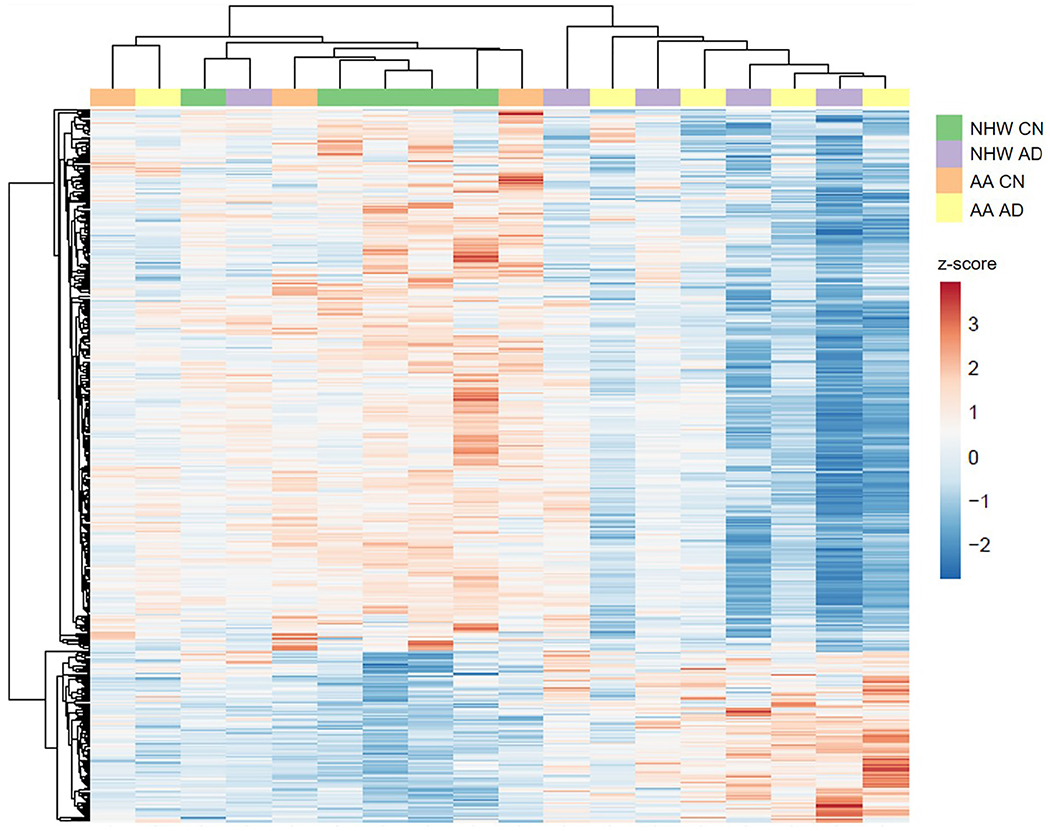
Fig. 3.

Heatmap with clustering of proteins in hippocampus. ClustVis was used to create a heatmap from the TMT reporter ion intensities for the differentially-expressed proteins in hippocampus (N = 472) across individuals (N = 18; see (Metsalu and Vilo, 2015)). The columns correspond to the individuals while the rows correspond to the proteins. Rows are centered; unit variance scaling is applied to rows. Both rows and columns are clustered using correlation distance and average linkage. The proteins corresponding to the heatmap can be found in Supplementary Data 4. Abbreviations: AA, African American/Black; CN, cognitively normal; NHW, non-Hispanic White; AD, Alzheimer’s disease.
