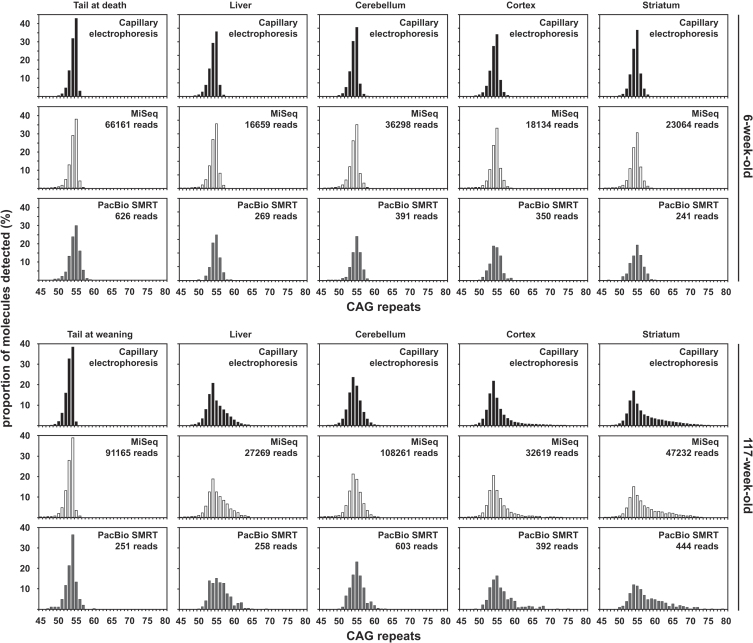
Fig. 1.
Qualitative assessment of somatic mosaicism comparing CAG frequency distributions obtained by capillary electrophoresis, MiSeq or PacBio SMRT sequencing of bulk-PCR products obtained for different tissues of one 6-week-old and one 117-week-old R6/2 mouse with ∼55 CAGs. Capillary electrophoresis data in black, MiSeq sequencing data in white and PacBio SMRT sequencing data in grey.

