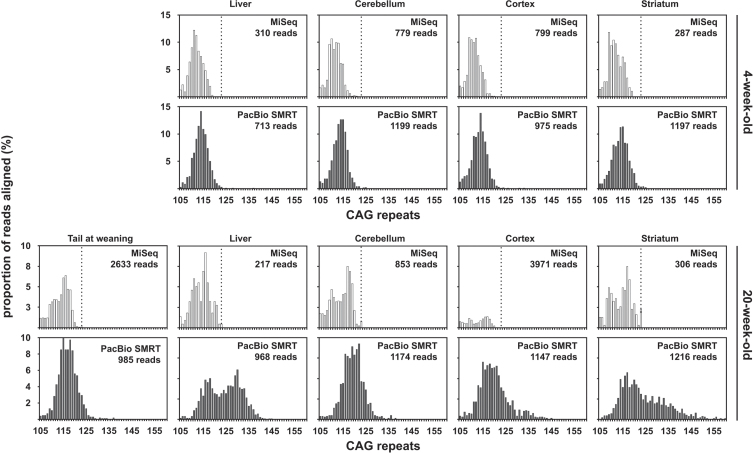
Fig. 4.
CAG frequency distributions obtained by MiSeq or PacBio SMRT sequencing of bulk-PCR products obtained for different tissues of one 6-week-old and one 117-week-old R6/2 mouse with ∼110 CAGs. MiSeq sequencing data in white and PacBio SMRT sequencing data in grey. The dotted line on the MiSeq sequencing data panels indicates 123 CAGs, which is the theoretical maximum number of CAGs that could have been sequenced using the PCR primer pair (31329/33934) and a 400 nt MiSeq read.

