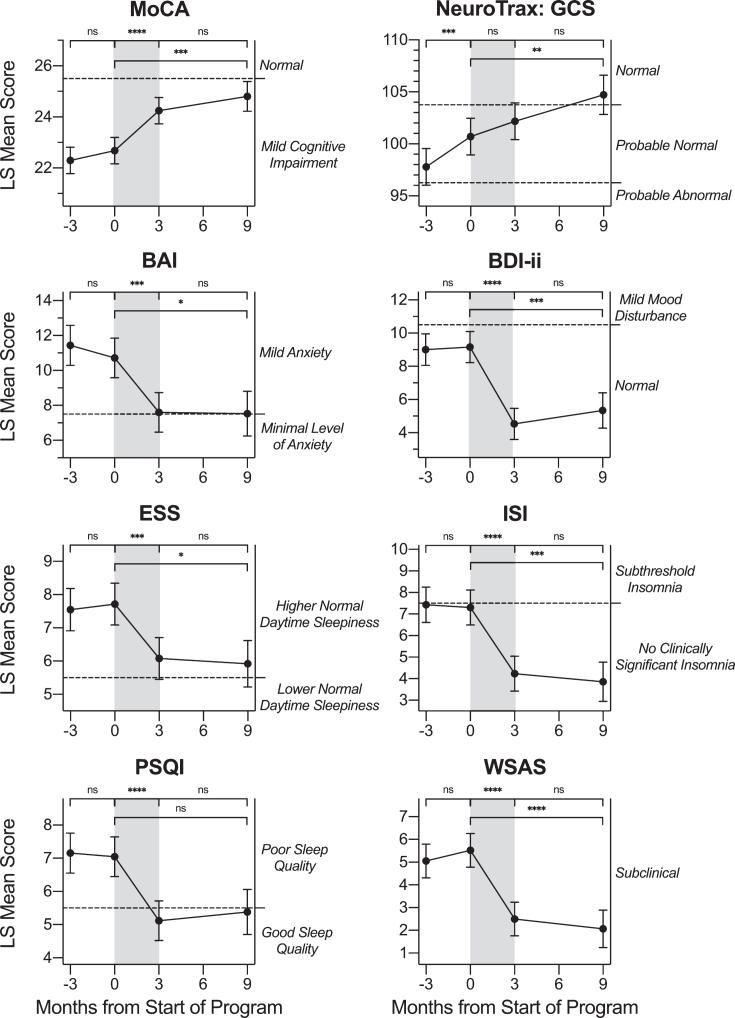
Fig. 3.
Change in Neurocognitive and Self-Report Measures across Timepoints. LS mean values for neurocognitive and self-report questionnaire scores at each timepoint: -3 months (baseline assessment), 0 months (pre-treatment assessment), 3 months (post-treatment assessment) and 9 months (follow-up assessment). Pairwise LS mean change values between timepoints are summarized in the top of each graph (values from Table 2). For all neurocognitive and self-report measures except for the NeuroTrax, there was a score change observed after the active treatment period (gray shading) in a direction indicating improvement. Error bars represent the standard error. MoCA: Montreal Cognitive Assessment; NeuroTrax GCS: Global Cognitive Score; BAI: Beck Anxiety Inventory; BDI-ii: Beck Depression Inventory-II; ESS: Epworth Sleepiness Scale; ISI: Insomnia Severity Index; PSQI: Pittsburgh Sleep Quality Index; WSAS: Work and Social Adjustment Scale. ns: p > 0.0125, change not significant at the Bonferroni-corrected significance level. * p≤0.0125. ** p≤0.008. *** p≤0.001. **** p≤0.0001.

