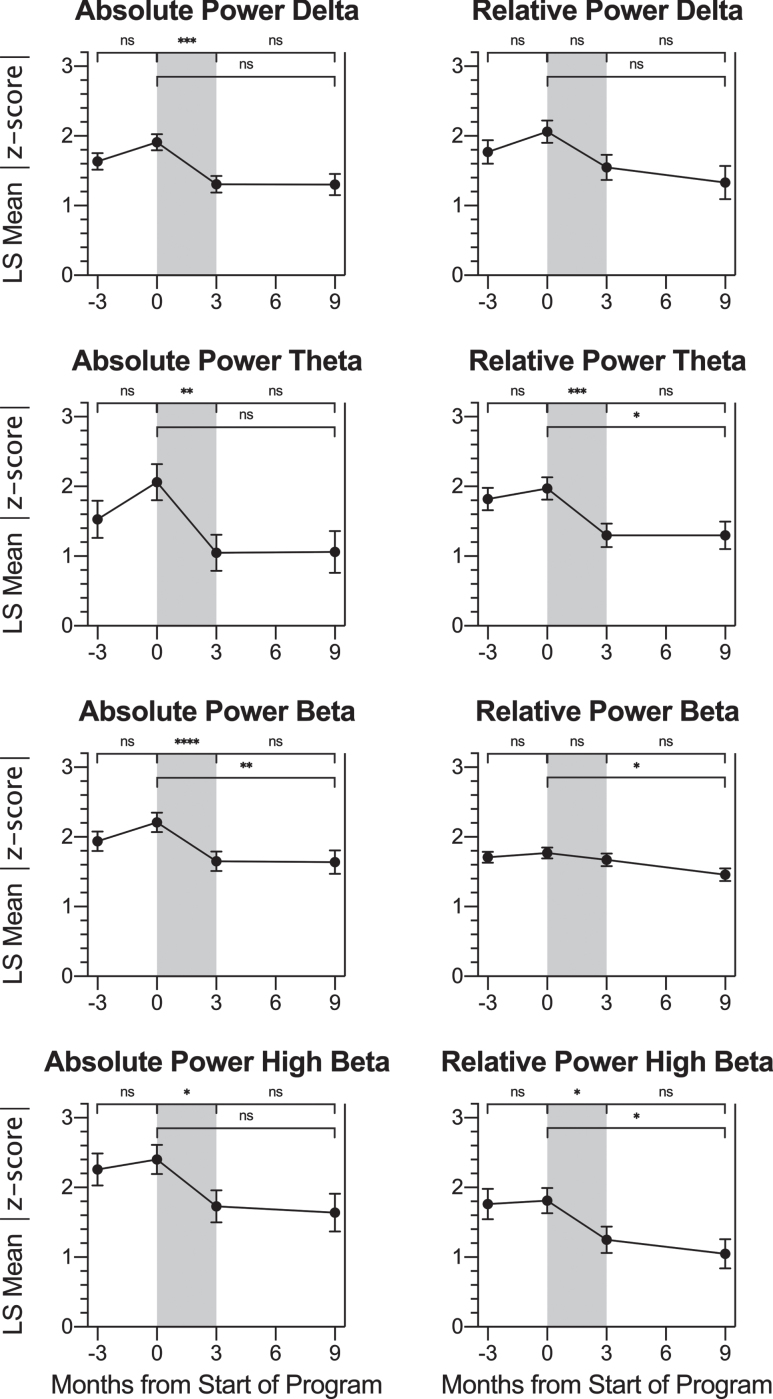
Fig. 5.
Change in QEEG Metrics across Timepoints. For participants with SOIs at trained sites, LS mean |z-score| values at each timepoint: -3 months (baseline assessment), 0 months (pre-treatment assessment), 3 months (post-treatment assessment) and 9 months (follow-up assessment) are shown for the QEEG parameters absolute power and relative power percent for the frequency bands delta, theta, beta, and high beta. Pairwise LS mean change values between timepoints are summarized in the top of each graph (values from Table 4). There was no change in |z-score| over the control or follow-up period for any parameter. For absolute power of delta, absolute power of theta, relative power of theta, absolute power of beta, absolute power of high beta, and relative power of high beta, there was a significant decrease (improvement) in |z-score| over the treatment period (gray shading). Error bars represent the standard error. ns: p > 0.0125, change not significant at the Bonferroni-corrected significance level. * p≤0.0125. ** p≤0.008. *** p≤0.001. **** p≤0.0001.

