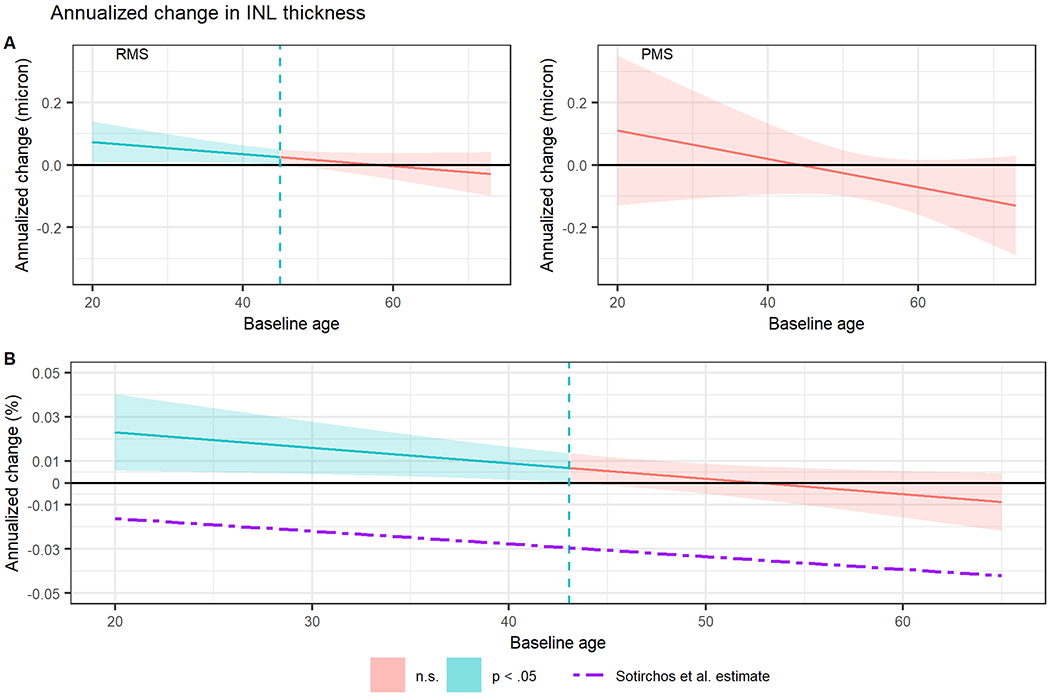
Figure 1.

Simple slopes analysis showing interaction between age at first visit and change in inner nuclear layer (INL) thickness over time in (A) patients with remitting multiple sclerosis (RMS) and progressive multiple sclerosis (PMS) and in (B) the whole cohort, comparing our results to the Sotirchos et al model. Shaded regions represent 95% confidence intervals for annualized change in INL thickness and the dashed vertical lines represent upper bounds of baseline age where the annualized change is statistically significant (Johnson–Neyman interval). n.s., not significant.
