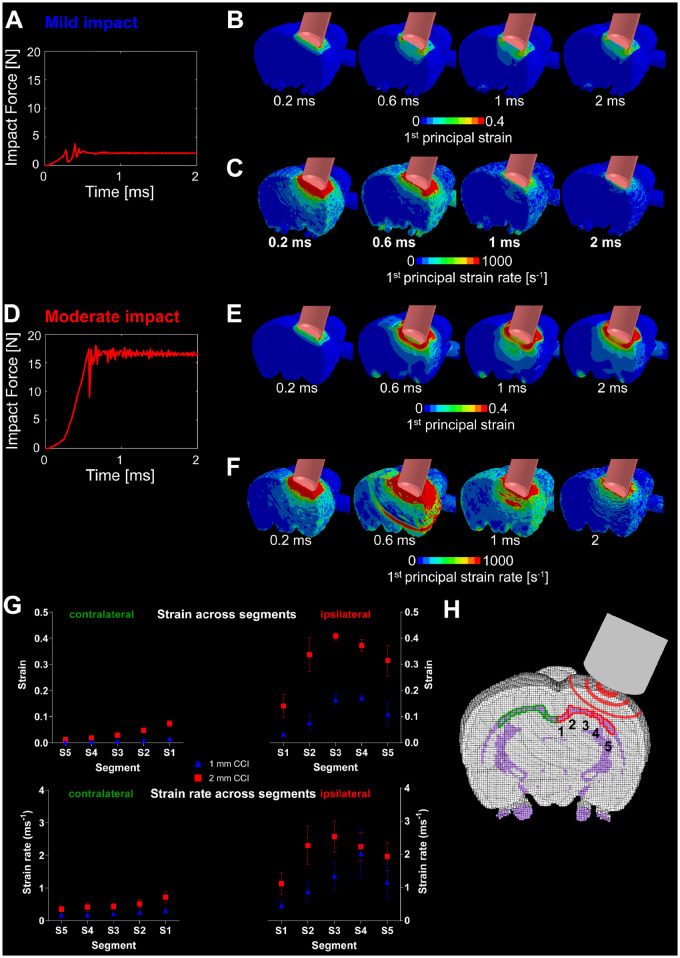
Figure 2.
Computational prediction of strain and strain rate following simulated impact. (A) Impact force as shown over time for mild impact. (B) Time-variant first principal strain contour for mild impact. (C) Time-variant first principal strain rate contour for mild impact. (D) Impact force as shown over time for moderate impact. (E) Time-variant first principal strain contour for moderate impact. (F) Time-variant first principal strain rate contour for moderate impact. (G) Computational prediction of strain and strain rate in five segments of the corpus callosum at approximately −3.12 mm posterior to bregma. These correspond to the maximum value of strain and strain rate for each element throughout the simulation (see Fig. 3B, D and E). Data are presented as mean (± SD) strain/strain rate of the values in each segment. (H) A sketch of the five ipsi- and contralateral segments of the corpus callosum located at approximately −3.12 mm posterior to bregma.

