Figure 3.
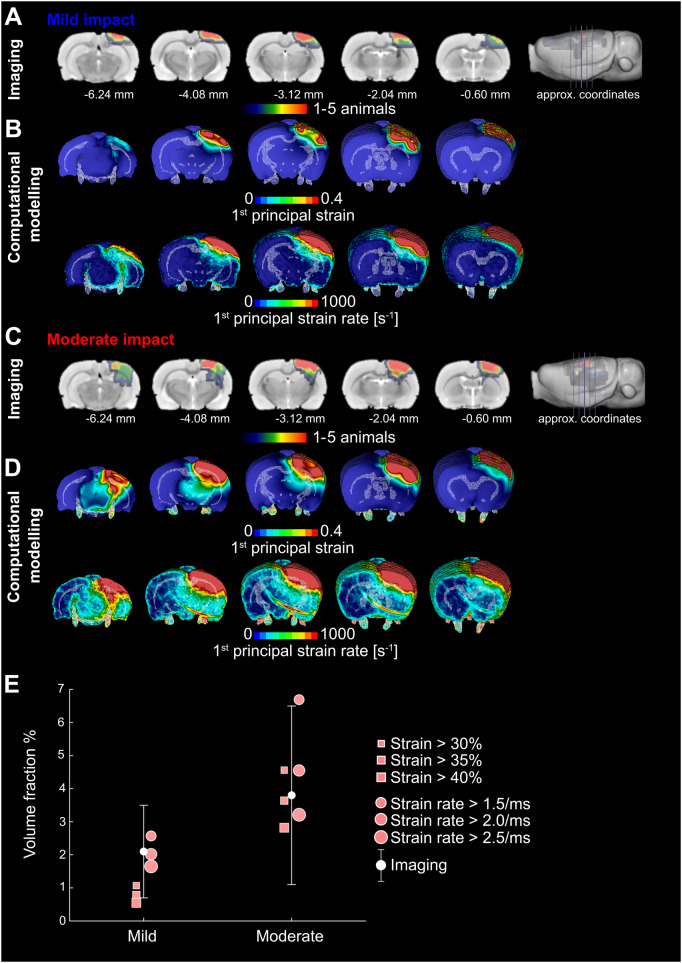
FE modelling predicts contusion as measured by T2 MRI. (A) Lesion probability maps after mild impact showing contusion/oedema with approximate coordinates from bregma. Colour scale indicates number of animals with visible lesions in T2-weighted images. Red–orange indicates regions where lesions were present in four or five (∼50%) of the CCI rats, green indicates regions where they were present in two or three (∼25%) and blue where a lesion was found in one post-surgery rat only; numbers indicate approximate coordinates from bregma. (B) First principal strain and strain rate predictions of the finite element model for mild injuries. These correspond to the maximum value of strain and strain rate for each element throughout the simulation. (C) Lesion probability maps after moderate injury showing contusion/oedema. (D) First principal strain and strain rate predictions of the finite element model for moderate injuries. These correspond to the maximum value of strain and strain rate for each element throughout the simulation. (E) Imaging: mean and standard deviation of the brain volume with contusion normalized by the total brain volume (volume fraction). These data are obtained from T2 lesion maps. The figure also shows the computational predictions of the volume of the brain that exceeds different values of strain and strain rate. The figure shows that the model prediction of the contusion volume is within one standard deviation of the empirical data.

