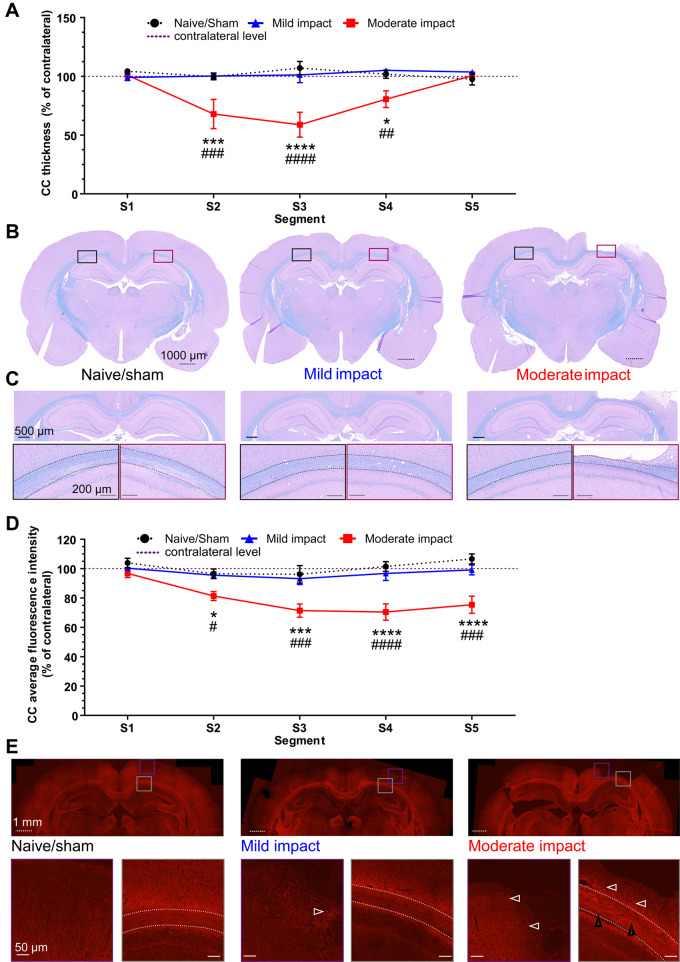
Figure 5.
Moderate impact causes thinning of corpus callosum in segments subjected to the high strain. (A) Thickness quantification of individual segments of the ipsilateral corpus callosum (in % of the respective contralateral segment) as measured every 500 µm. (B) Representative whole brain photomicrographs of sections stained with LFB from naive/sham animals (left), mild impact (middle) and moderate impact. (C) The entirety of the analysed corpus callosum (dotted outline) of the respective groups, with coloured rectangles showing magnified views of the contralateral and ipsilateral corpus callosum. Black dotted scale bars = 1000 µm (whole brain sections); black solid lines = 500 µm (entire corpus callosum); grey solid lines = 200 µm (magnifications). All data are presented as mean ± SEM. Naive/sham: n = 7; Mild impact: n = 6, Moderate impact CCI: n = 6. *P < 0.05, **P < 0.01, ***P < 0.001 and ****P < 0.0001 represent significant difference of moderate impact versus naive/sham animals. #P < 0.05, ##P < 0.01, ###P < 0.001 and ####P < 0.0001) represent significant difference of moderate versus mild impact. (D) Quantification of Alexa 568 immunofluorescence intensity for neurofilament staining in five segments of the corpus callosum. (E) Neurofilament Alexa 568 immunofluorescence in naive/sham (left block), mildly injured (middle block) and moderately injured animals (right block). Coloured rectangles show magnified areas of the pericontusional cortex (purple) and CC segments (grey) below the impact, indicating axonal spheroid bulbs (white arrowhead), axonal swelling and disorganization (black arrowheads) prominently in moderately injured animals (right block). White dotted scale bars correspond to 1000 µm (half brain sections) and white solid lines to 50 µm (insets). White dashed lines indicate the outline of the corpus callosum. All data are presented as mean ± SEM. Naive/sham: n = 5; mild impact: n = 6, moderate impact: n = 8. *P < 0.05, **P < 0.01, ***P < 0.001 and ****P < 0.0001 represent significant difference of moderate impact versus naive/sham animals. #P < 0.05, ##P < 0.01, ###P < 0.001 and ####P < 0.0001 represent significant difference of moderate versus mild impact.

