Figure 6.
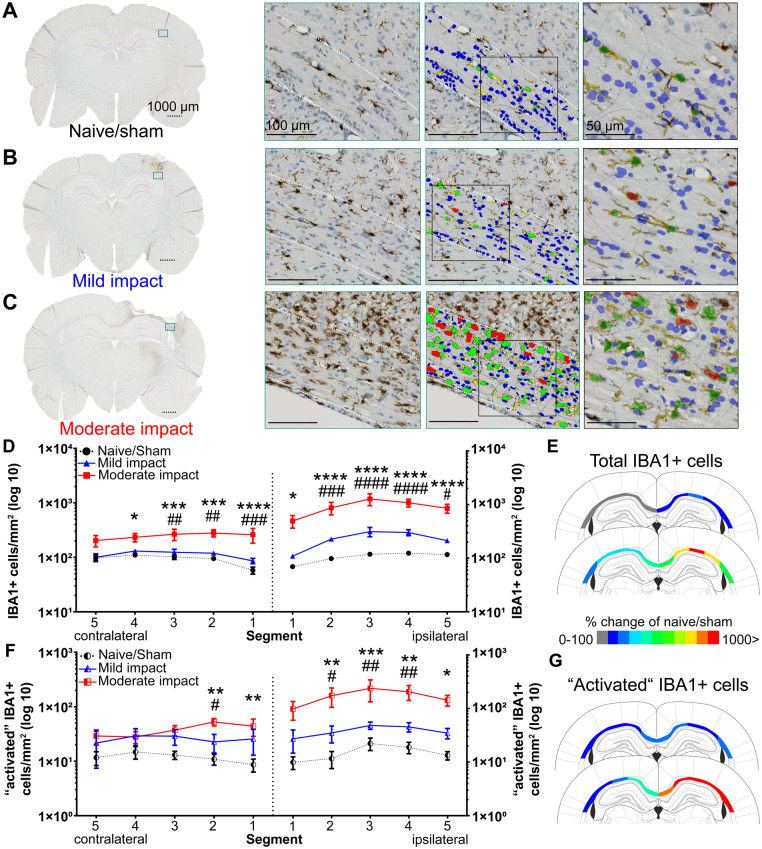
Moderate impact causes a significant microglial response in the corpus callosum. IBA1+ cells in the corpus callosum (dotted outline) of naive/sham animals (A) and following mild (B) and moderate (C) impact. Representative whole brain photomicrographs are shown in the left panel, with a coloured rectangle showing the magnified area (middle left). Middle right: The colour-coded overlay of detected IBA+ cells (green; red indicating ‘activated’ IBA+ cells) with processes (yellow) and haematoxylin+ cells not classified as microglia (blue). Right: A magnified view with transparent overlay. Dotted scale bars = 1000 µm, solid lines = 100/50 µm. (D) HALO quantification of total IBA1+ cells in five segments of the ipsilateral and contralateral corpus callosum. (E) Colour-coded heat map, showing per cent changes of total IBA1+ cells (rounded, compared to naive/sham animals) in the individual segments of the corpus callosum of animals subjected to mild (top) and moderate impact (bottom) (F) HALO quantification of IBA1+ cells classified as ‘activated' in five segments of the ipsilateral and contralateral corpus callosum. (G) Colour-coded heat map, showing per cent changes of IBA1+ ‘activated' cells (rounded, compared to naïve/sham animals) in the individual segments of the corpus callosum of animals subjected to mild (top) and moderate impact (bottom). All data are presented as mean ± SEM. Naive/sham: n = 7; mild impact: n = 6, moderate impact: n = 6. *P < 0.05, **P < 0.01, ***P < 0.001 and ****P < 0.0001 represent significant difference of moderate impact versus naive/sham animals. #P < 0.05, ##P < 0.01, ###P < 0.001 and ####P < 0.0001 represent significant difference of moderate versus mild impact.

