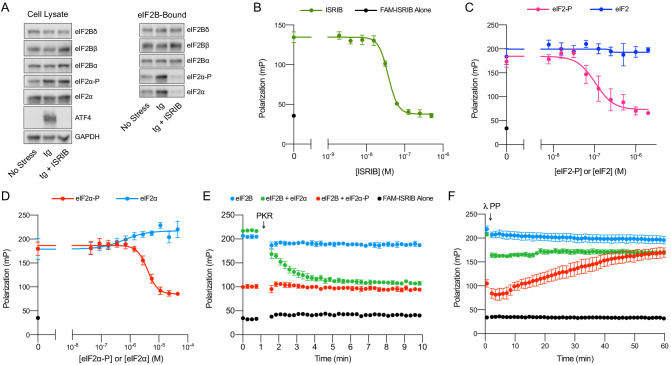
Figure 4. ISRIB and eIF2-P compete for eIF2B binding.
(A) Western blot of K562 integrated stress response (ISR) reporter cell extracts after treatment with tg ± ISRIB as indicated (left panel) or of eIF2B-bound fraction isolated by anti-FLAG immunoprecipitation of the eIF2B-mNeonGreen-FLAG tagged subunit under native conditions (right panel). (B–D) Plot of fluorescence polarization signal after incubation of FAM-ISRIB (2.5 nM) with 100 nM eIF2B(αβδγε)2 and varying concentrations of (B) ISRIB (IC50 = 37 nM; s.e.m. = 1 nM), (C) eIF2 or eIF2-P (IC50 = 210 nM; s.e.m. = 120 nM), and (D) eIF2α or eIF2α-P (IC50 = 4000 nM; s.e.m. = 200 nM). (E–F) Timecourse of fluorescence polarization signal after addition of (E) eIF2α kinase PKR and ATP or (F) λ phosphatase. FAM-ISRIB was at 2.5 nM. eIF2B(αβδγε)2 was at 100 nM. eIF2α and eIF2α-P were at 5.6 μM. In (A), eIF2Bδ, eIF2Bα, and eIF2α blots, eIF2Bβ and eIF2α-P blots, and ATF4 and GAPDH blots are from the same gels, respectively. All cell lysate or eIF2B-bound lanes across all gels were loaded with equal total protein. Biological replicates: (B) n = 3; (C) n = 5 (n = 4 at 2 μM); and (D–F) n = 3. All error bars represent s.e.m.

