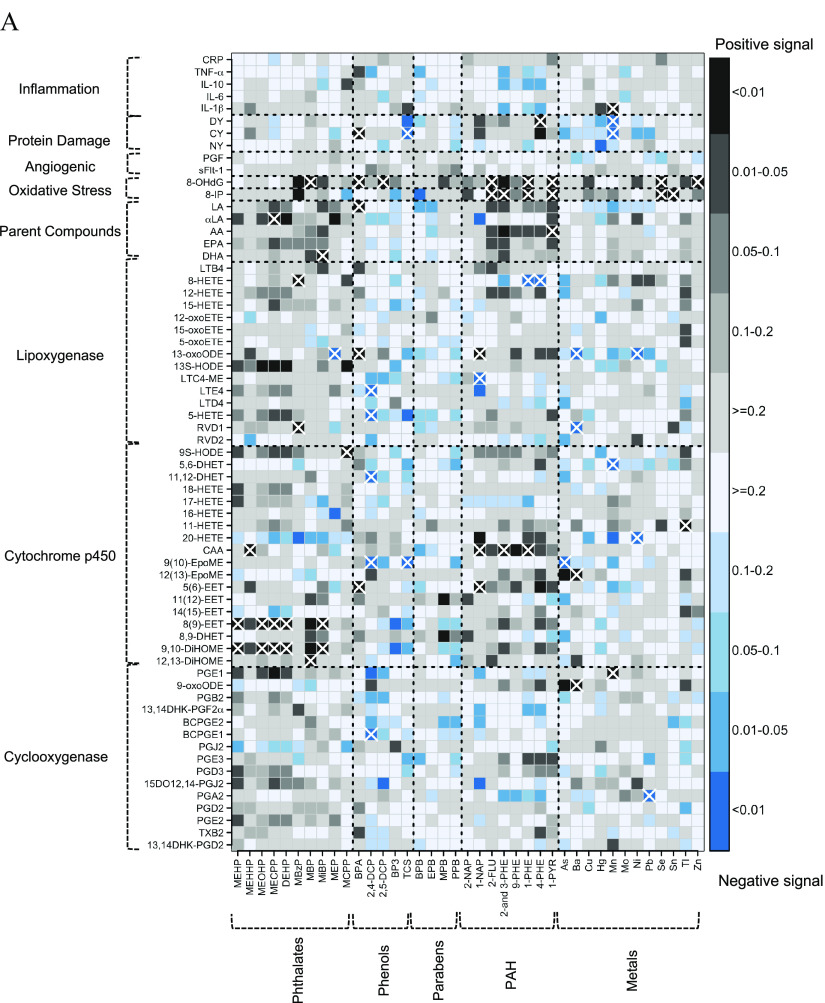
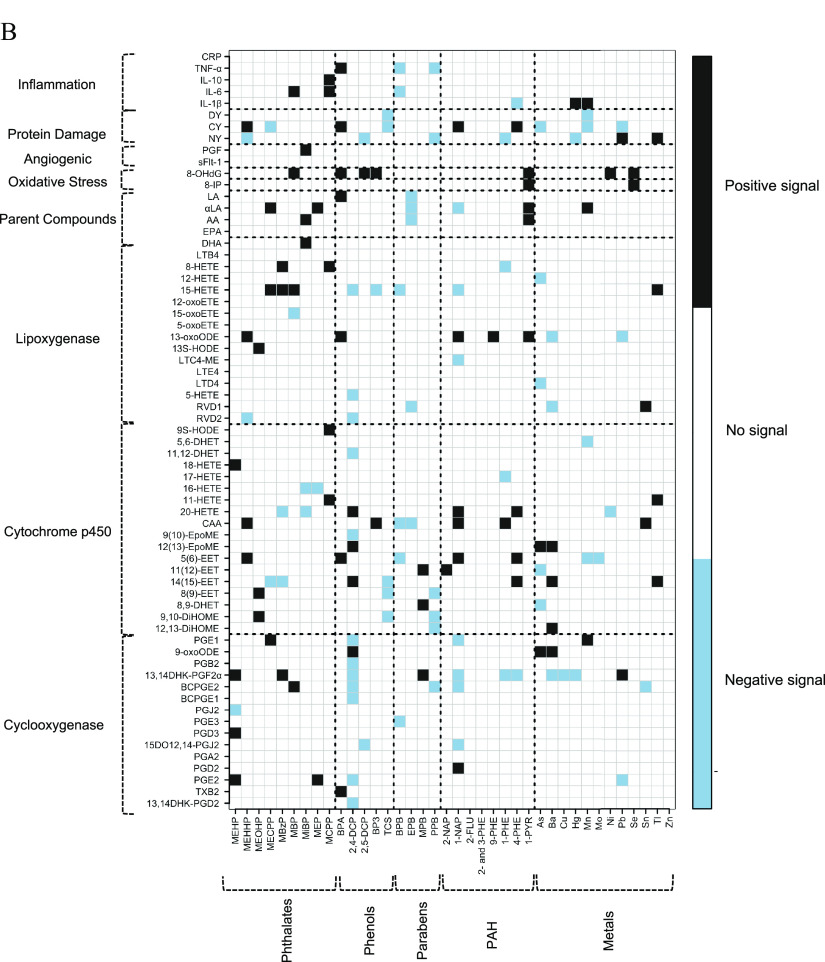
Figure 2.
(A) Heat map of pair-wise associations between exposure analytes and endogenous biomarkers estimated using multiple linear regression and inverse probability weights. Models adjusted for maternal age, race, education, health insurance provider, body mass index at first visit, and specific gravity. The sample size for most models was , except for the following biomarkers: BCPGE1 (), LTE4 (), sFlt-1 (), and PGF (). Black and blue grids indicate positive and negative associations, respectively. Color intensities are representative of -values, that is, darker grids indicate smaller -values. Pair-wise associations that remain significant after controlling the false-discovery rate at 0.2 are labeled by white X symbols. Dashed lines delineate biomarker subgroups and toxicant classes. See Excel Table S3 for the corresponding numeric data. (B) Heat map of multipollutant associations between exposure analytes and endogenous biomarkers selected by adaptive elastic net. Models adjusted for maternal age, race, education, health insurance provider, body mass index at first visit, specific gravity, and preterm birth case status. The sample size for most models was , except for the following biomarkers: BCPGE1 (), LTE4 (), sFlt-1 (), and PGF (). Black and blue grids indicate positive and negative signals, respectively. Dashed lines delineate biomarker subgroups and toxicant classes. See Excel Table S4 for the corresponding numeric data. Abbreviations and subclasses of toxicants are defined in Figure 1.


