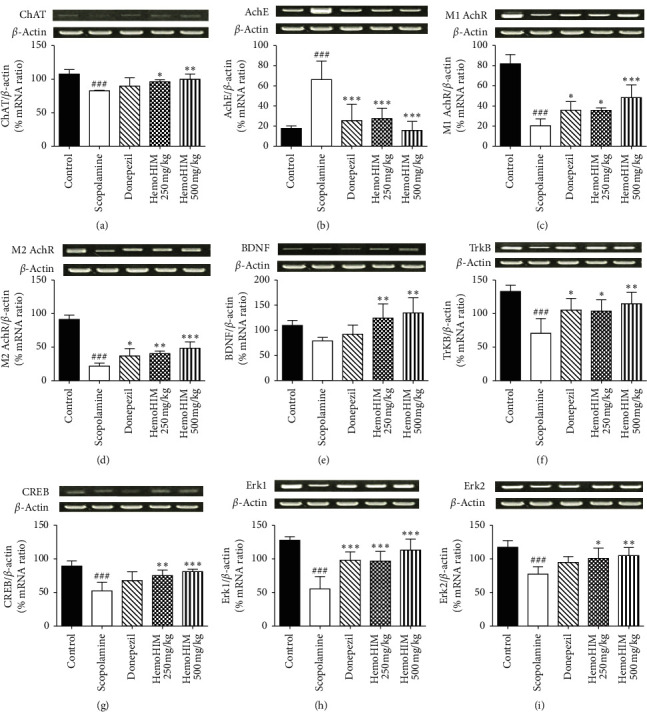
Figure 6.

The effects of HemoHIM on mRNA expression of (a) ChAT, (b) AchE, (c) mAchR M1, (d) mAchR M2, (e) BDNF, (f) TrkB, (g) CREB, (h) Erk1, and (i) Erk2 in the scopolamine-induced model. The mRNA expression was measured by RT-PCR using specific primers. β-actin levels were compared for the equal loading control. Quantitative analysis of relative expression for BDNF/β-actin was represented as graph. The data are expressed as the mean ± S.E.M. (n = 4∼5 per group). Significant difference from control group (###P < 0.001) and from scopolamine-treated group (∗∗∗P < 0.001, ∗∗P < 0.01, ∗P < 0.05).
