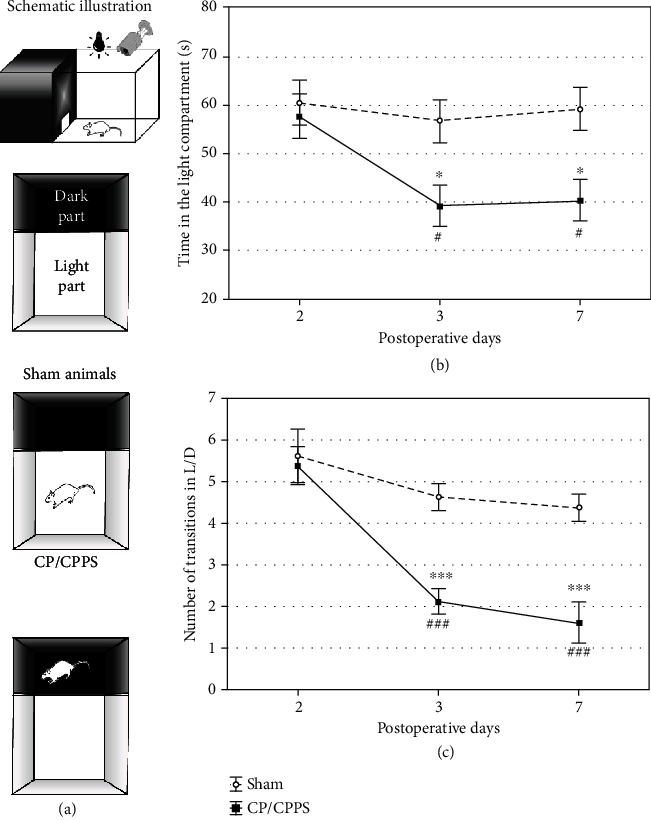
Figure 6.

Schematic illustration (a), the time in the light compartment (b), and the number of transitions between the light and the dark compartment (c) in the light/dark test observed in sham and CP/CPPS groups. Values are mean ± SEM. The statistical difference between the groups was estimated by Student's t-test (∗p < 0.05 and ∗∗∗p < 0.001 vs. sham), while within-group differences were estimated by one-way ANOVA with the Tukey-Kramer LSD post hoc test (#p < 0.05 and ###p < 0.001 vs. 2 d, n = 6 per group). For details, see the caption of Figure 1.
