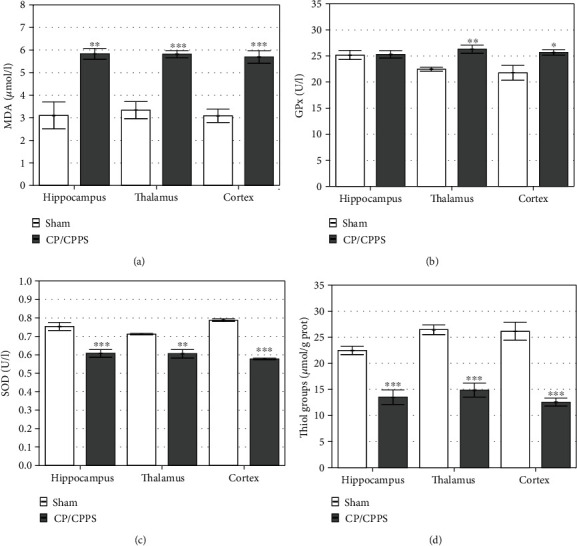
Figure 7.

Oxidative stress parameters in the brain structures: malondialdehyde (MDA, a) level, the activity of glutathione peroxidase (GPx, b), the activity of superoxide dismutase (SOD, c), and the level of thiol groups (d) determined in the hippocampus, thalamus, and cerebral cortex in sham and CP/CPPS groups seventh day after intraprostatic injection. Values are mean ± SEM. The statistical difference between the groups was estimated by Student's t-test (∗p < 0.05, ∗∗p < 0.01, and ∗∗∗p < 0.001 vs. sham, n = 6 per group). For details, see the caption of Figure 1.
