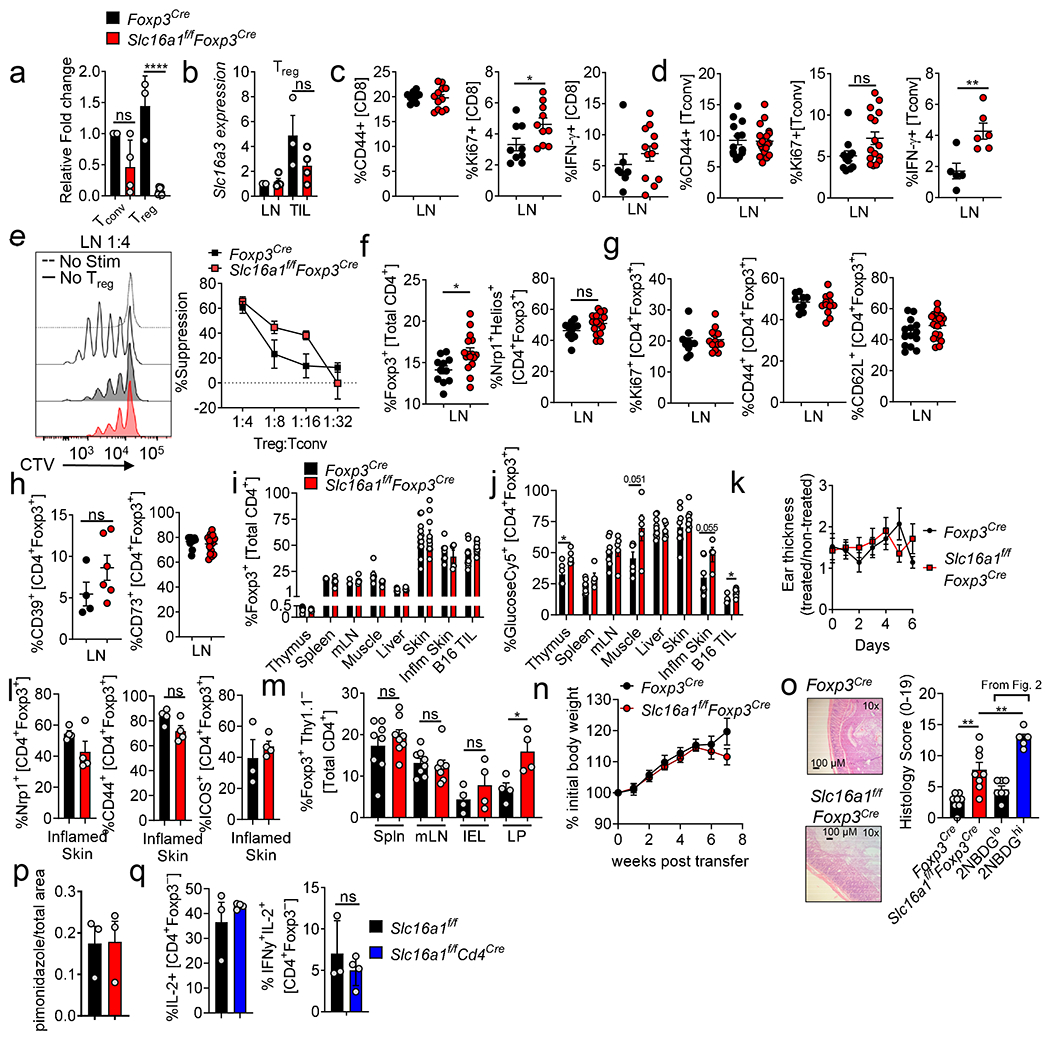
Extended Data Figure 3. Treg cells are resistant to lactic acid and use PEPCK-mediated metabolic pathways to support their proliferation.

(a) Proliferation of CD8+, Tconv, and Treg cells labeled with CellTrace Violet (CTV) activated in media with lactic acid for 3 days (**p=0.0058). (b) IFN-γ production of CD8 and Tconv cells conditioned as in (a) then restimulated overnight with PMA/ionomycin (CD8 **p=0.0042, Tconv *p=0.02). (c) Suppression assay using Treg cells conditioned as in (a) performed in absence of additional lactic acid. (d) Representative histogram and quantification of pHrodo+ Treg cells taking up 2NBDG. (e) Representative flow plot of Ki67 expression by B16-infiltrating Treg cells from mice treated ±3MP for 3 days. (f) Suppressive capacity of Treg cells, isolated from mice as in Fig.3k. (g) Percent Foxp3+ cells, Tconv:Treg ratio, and CD8:Treg ratio within the TIL of mice treated as in (f). (h) Tumor growth curve of B16 in C57BL/6 mice treated with H2O or 3MP. (i) Proliferation of Treg and Tconv cells activated and cultured in 10mM lactic acid media ±3MP for 3 days (*p=0.016). (j) Capacity of activated Treg cells conditioned in 10mM lactic acid media ± 250μM 3MP for 3 days to suppress the proliferation of CTV labelled Tconv cells. (k) IFN-γ expression by CD8 and Tconv cells in Foxp3Cre or Slc16a1f/fFoxp3Cre mice treated as in (f). (l) Percent Foxp3+ cells, Tconv to Treg ratio, and CD8 to Treg ratio within LN and tumor of Slc16a1f/fFoxp3Cre mice treated as in (f). Results are representative of four (d), three (a,b,c,f,g,i), or two (h,j,k,l) independent experiments. Significance (*p< 0.05, **p <0.01, ***p < 0.001, ****p<0.0001) determined by unpaired two-tailed t test (d,e,g,i,k,l) or one-way ANOVA with Dunnett’s multiple comparisons test (a,b) or two-way ANOVA with Sidak's multiple comparisons test (c,f,h,j). Data are mean values of biological replicates ±SEM.
