
Extended Data Fig. 8. Comparison of Tyr308 in native and substrate-bound structures.
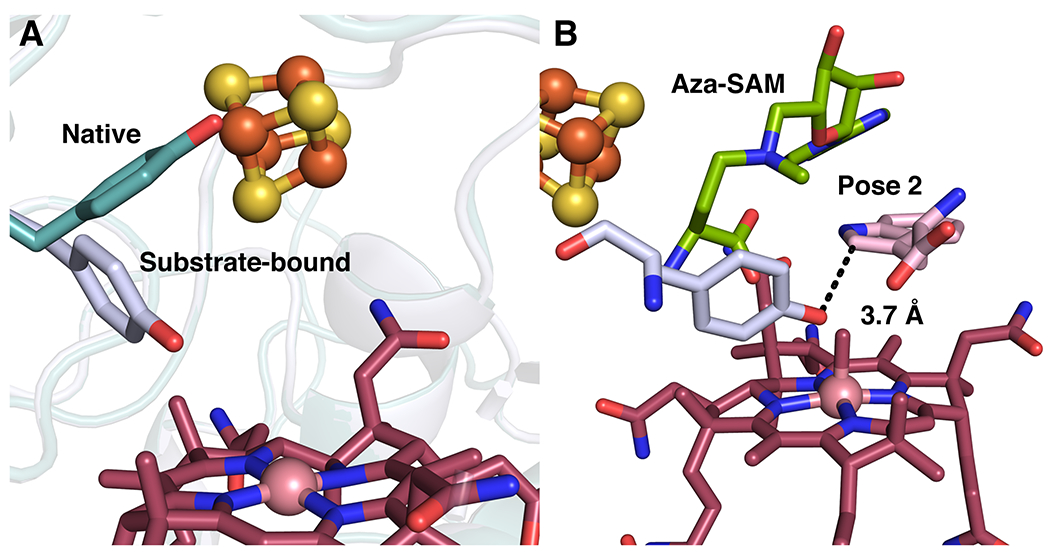
(A) Overlay of KsTsrM native structure (teal) with substrate bound structure (light blue), showing change in conformation of Tyr308. (B) Positioning of Tyr308 in docking model with pose 2, showing proximity to C2 position of Trp.