
Extended Data Fig. 9. Analysis of MeCbl formation using dcSAM.
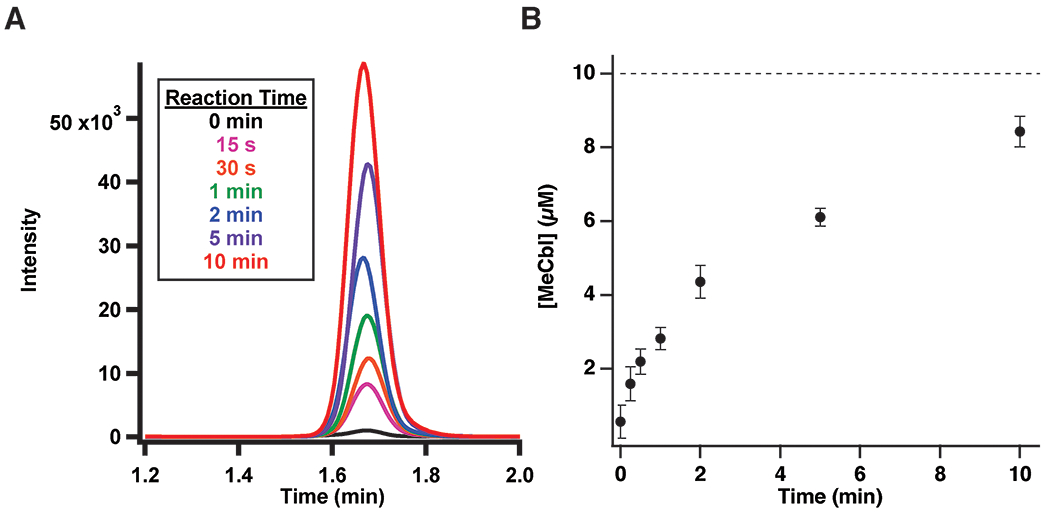
(A) LC-MS/MS analysis of MeCbl formation in a reaction containing TsrM (10 μM), flavodoxin/flavodoxin reductase/NADPH, and dcSAM (1.5 mM). (B) Time-dependent formation of MeCbl. Error bars represent the standard deviation of triplicate determinations. The dashed line indicates the concentration of enzyme in the reaction, with the central point representing the average.