
Figure 2. Effects of pravastatin on calcium deposits by μCT/μPET imaging.
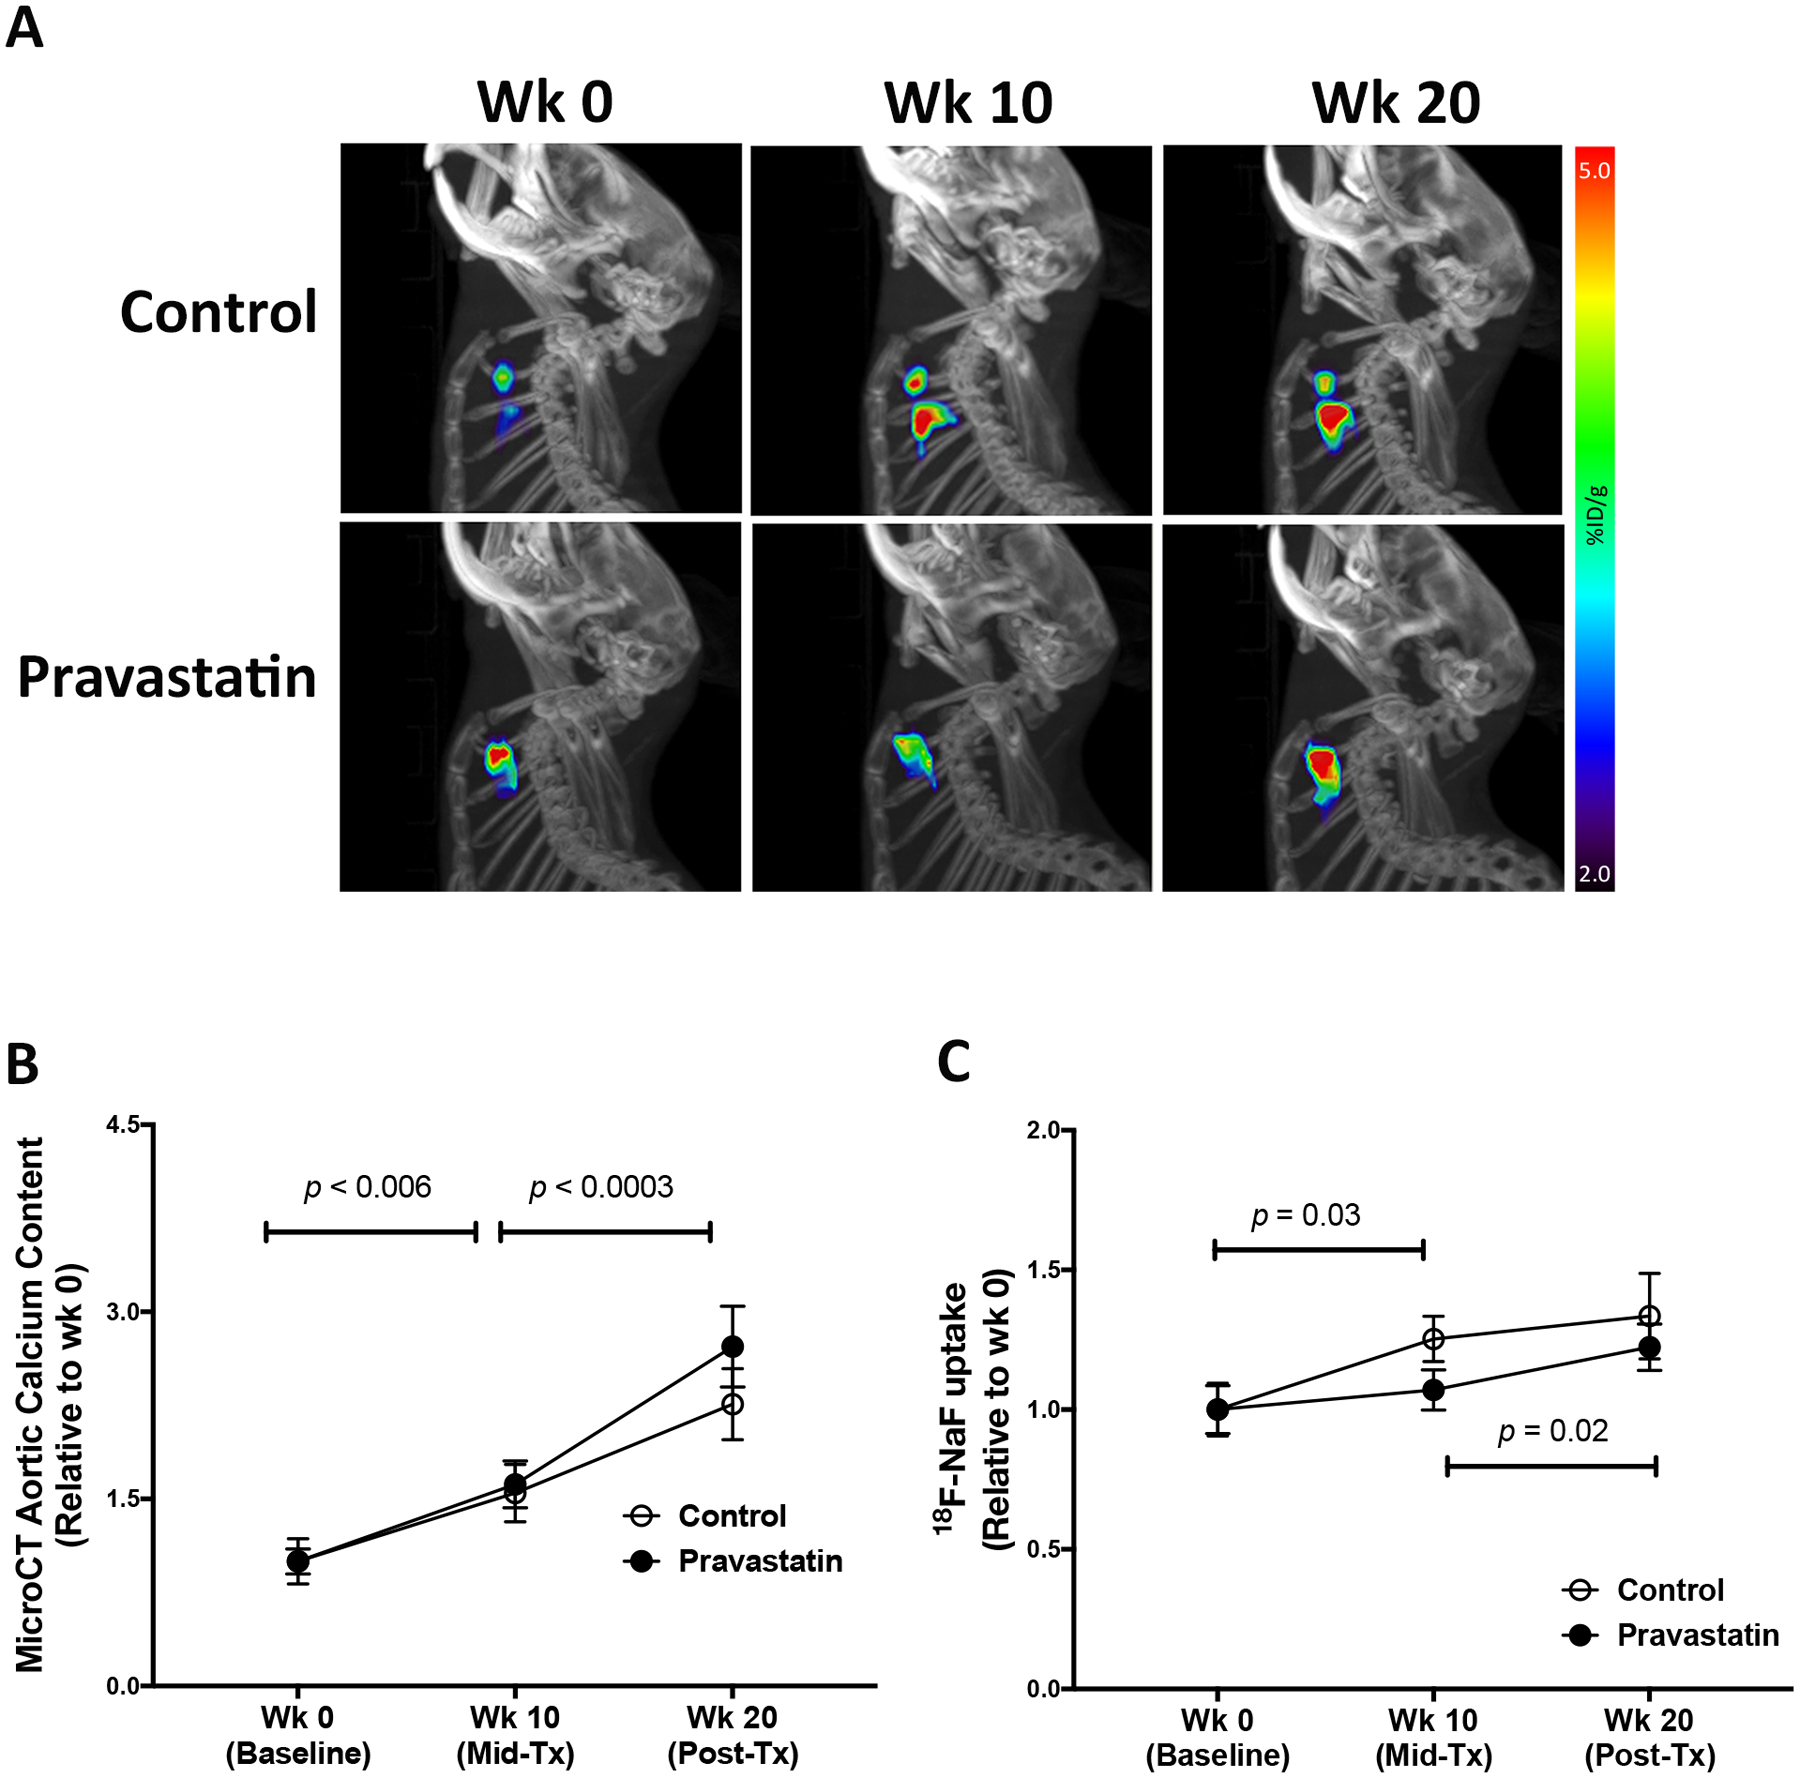
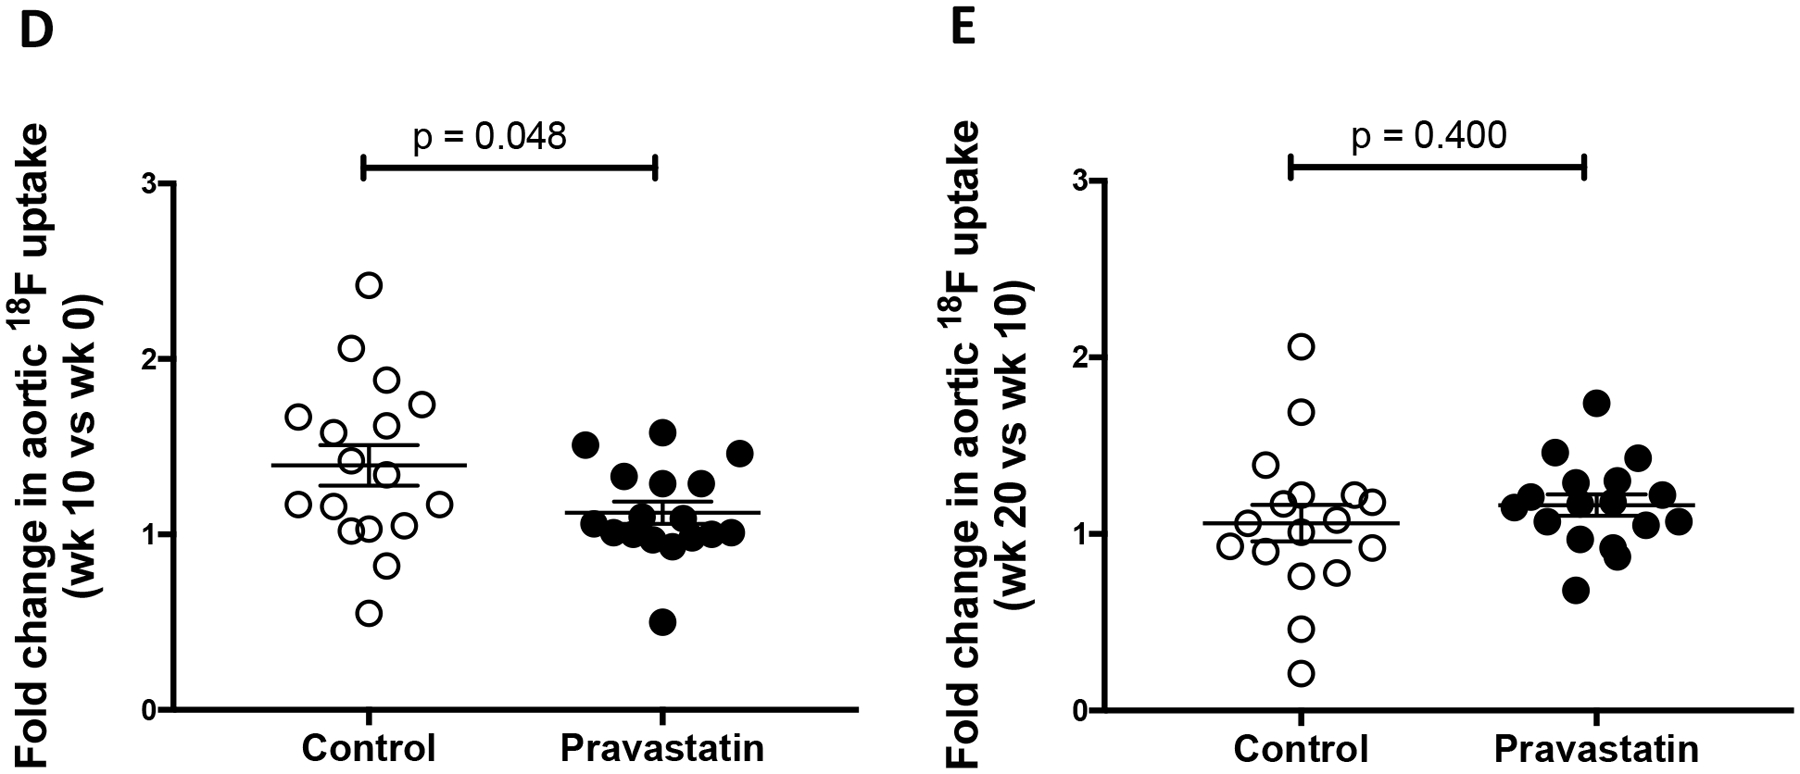
(A) A representative lateral view of the μPET maximum-intensity projection (pseudo-color) superimposed on the μCT image of the skeleton in the control and pravastatin-treated mice at baseline (wk 0), mid-treatment (wk 10), and post-treatment (wk 20). (B) MicroCT analysis of aortic calcium content in the control (n = 18) and pravastatin-treated (n = 16) mice. (C) MicroPET analysis of aortic 18F-NaF uptake in the control (n = 17) and pravastatin-treated (n = 17) mice. *p = 0.03 (Control wk 10 vs. wk 0), **p = 0.02 (Pravastatin wk 20 vs. wk 10). (D) Fold-change in 18F-NaF uptake over the first 10-wk period (wk 10 vs. wk 0) in the control (n = 17) and pravastatin-treated (n = 17) mice. (E) Fold change in 18F-NaF uptake over the second 10-wk period (wk 20 vs. wk 10) in the control (n = 17) and pravastatin-treated (n = 17) mice.